Figure 4.

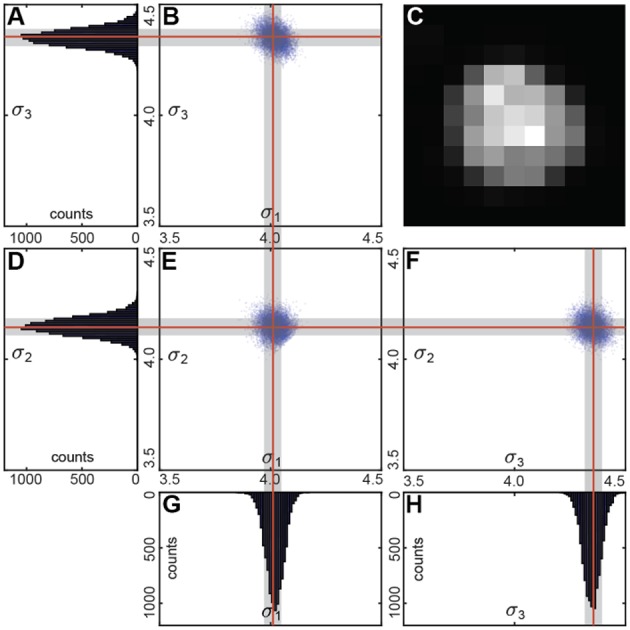
(C) Sample cell. Bootstrap Gaussian fit: (B,E,F) principal components of the standard deviation for all the resamples and (A,D,G,H) its histograms. Mean values are indicated by the red lines, and standard deviations by the gray boxes.

(C) Sample cell. Bootstrap Gaussian fit: (B,E,F) principal components of the standard deviation for all the resamples and (A,D,G,H) its histograms. Mean values are indicated by the red lines, and standard deviations by the gray boxes.