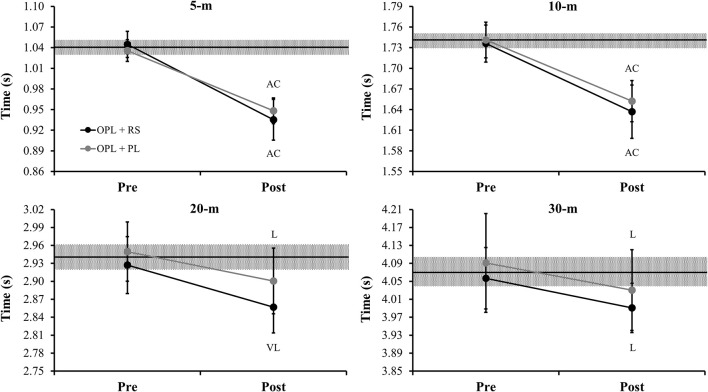
Figure 3.
Comparisons of the unloaded sprint times in 5-, 10-, 20-, and 30-m pre- and post- the preseason period for both power-oriented training groups. OPL: optimum power load; RS: resisted sprint; PL: vertical and horizontal plyometrics; middle black lines represent the mean values between two groups in the “pre” measures; gray areas represent the smallest worthwhile change (0.2 × between subject SD); Error bars represent 90% confidence limits; AC: almost certainly difference in comparison to pre-values; VL: very likely difference in comparison to pre-values; L: likely difference in comparison to pre-values.

