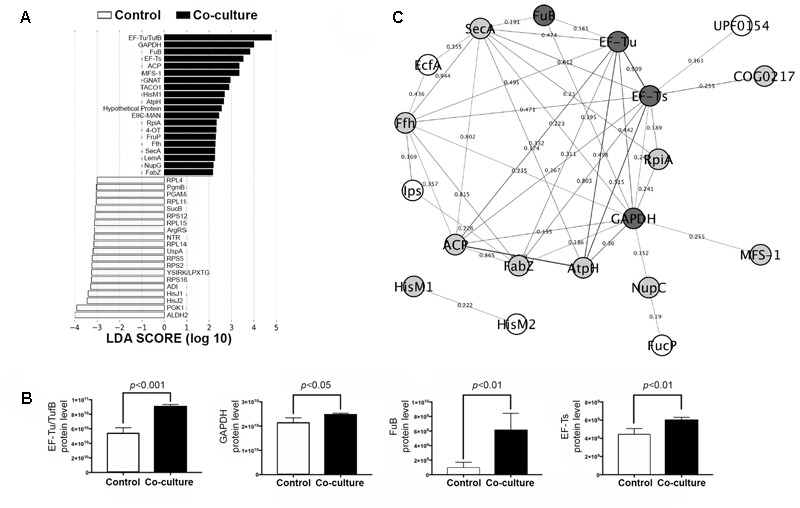
FIGURE 2.

Biomarker analysis and protein–protein interaction (PPI) network in the LM1 proteome. (A) Linear discriminant analysis (LDA) effect size (LEfSe) score showing the statistical significance, biological consistency, and effect-size estimation of predicted biomarkers in control and co-culture groups. (B) LM1 PPI network analysis of DEPs in the STRING database using Cytoscape version 3.0. The nodes (proteins) and edges (combined scores) are plotted. Proteins reported to have adhesion or moonlighting ability (dark gray), putative function in adhesion (gray), and unknown adhesion capability (white). (C) Relative abundance of the top four discriminative proteins (EF-Tu/TufB, GAPDH, FuB, and EF-Ts) in LM1 after co-culture. p-values < 0.05 were considered significant.
