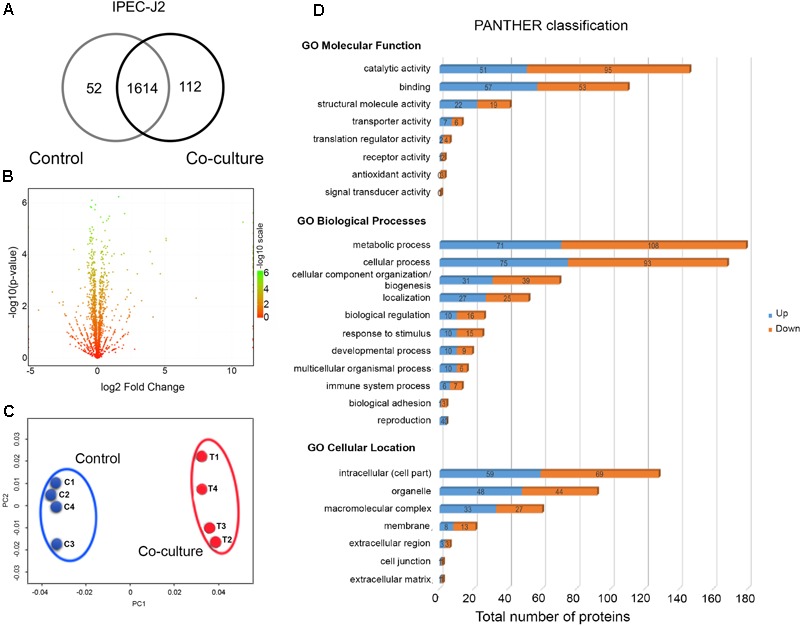
FIGURE 3.

Global proteome profile of IPEC-J2 cells in co-culture conditions. (A) Venn diagram of unique and shared proteins detected in IPEC-J2 cells. (B) A volcano plot of the deactivated/downregulated (left, 376) and activated/upregulated (right, 277) proteins in IPEC-J2 cells. p-values were calculated and plotted in the y-axis as –log10(p-value). Values for y-axis [–log10(p-value)] above 1.3 were considered significant. (C) Non-metric multidimensional scaling (NMDS) plot of individual IPEC-J2 proteomes showing distinct clustering of each group. Individual proteomes are separated in control (C1–C4) and co-culture (T1–T4). (D) Functional classification of LM1 proteins using Gene Ontology (GO) classification from the PANTHER database (Molecular Function, Biological Processes, and Cellular Location). The numbers of downregulated (orange) and upregulated (blue) proteins are shown.
