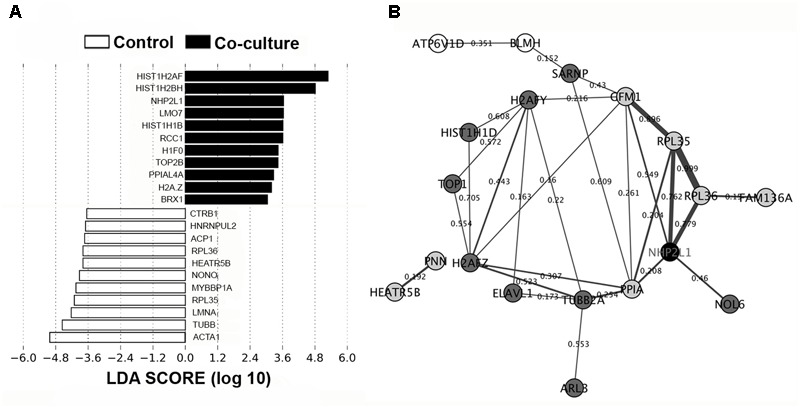
FIGURE 4.

Biomarker analysis and PPI network in the IPEC-J2 proteome. (A) LEfSe score showing the statistical significance, biological consistency, and effect-size estimation of predicted biomarkers in control and co-culture groups. (B) IPEC-J2 PPI network analysis of DEPs in the STRING database using Cytoscape version 3.0. The nodes (proteins) and edges (combined scores) are plotted. Proteins that were activated (black), upregulated (dark gray), downregulated (light gray), and deactivated (white). Co-expression values are represented by the thickness of the edges (thicker edges – high co-expression, thinner edges – low co-expression).
