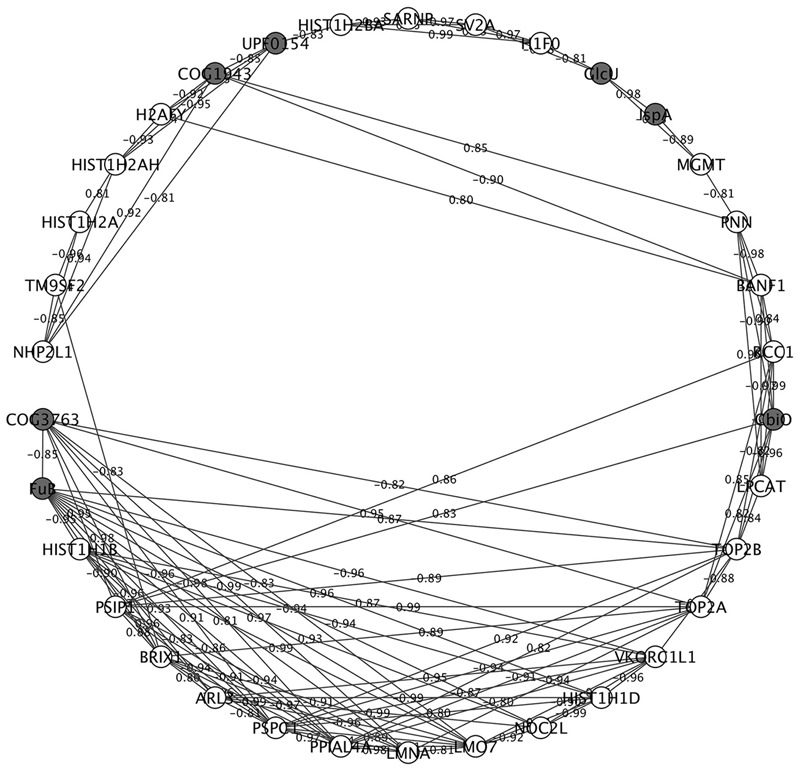
FIGURE 5.

Correlational network analysis of LM1 and IPEC-J2 proteins. Cytoscape visualization shows the high association between the nodes (proteins) and edges (correlation coefficient). Negatively and positively correlated proteins are indicated in the edges of each interaction. Proteins from LM1 (dark gray) and IPEC-J2 (white) proteomes are indicated. The absolute correlation coefficient of 0.8 or higher of highly regulated proteins was used in the plot.
