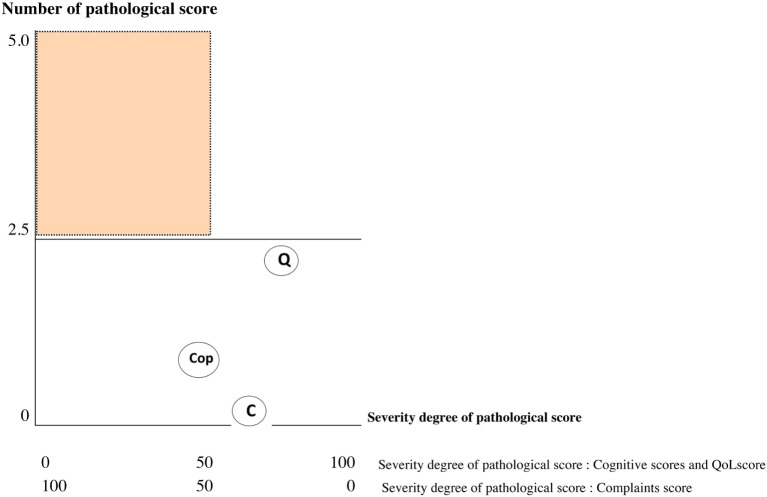
Figure 2.
Graph showing values of each sub-score: Subject 1 [favorable evolution (FE)]. C, cognition; Q, quality of life; Cop, complaint; red score, pathological score; black score, normal score; orange area, risk zone. If one of the three coordinates is in the red area = patient identified unfavorable evolution (UE).

