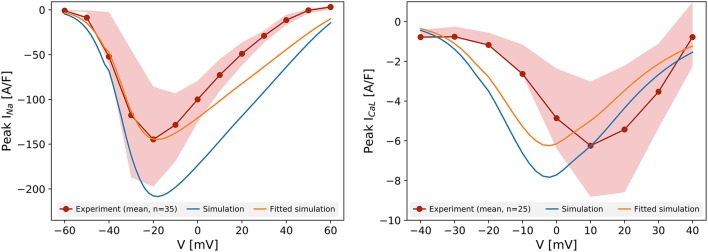
Figure 1.
Current-voltage relationship for INa (left) and ICaL (right). The red lines represent the mean peak current measured experimentally in 35 (INa) and 25 cells (ICaL), and the shaded areas show the 25th and 75th percentiles of the experimental data. The peak-current voltage relation simulated with the unaltered Paci et al. (2013) model for the same protocol is shown in blue. The orange lines show the simulated results after scaling to match the maximum current.

