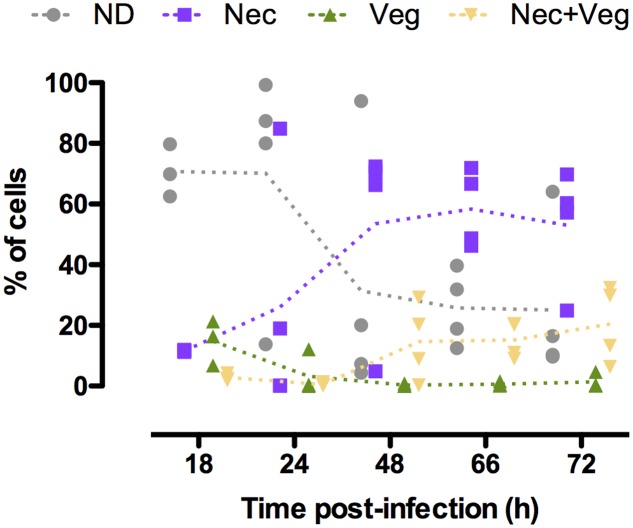
FIGURE 4.
abrB and nprA promoter activities in cells isolated from insect cadavers. Flow cytometry analysis of B. thuringiensis cells harboring pPabrB’gfpBteAAV-PnprA’mcherryLGC. Bacteria were isolated from cadavers of G. mellonella larvae infected by intrahemocoelic injection and incubated at 30°C. Samples were harvested 18, 24, 48, 66, and 72 h after injection. The percentage of cells of each population discriminated on cytograms (as described in the Supplementary Experimental Procedures) are presented as a function of time. Each population phenotype is associated to a color as indicated on the graph: ND, cells that do not express any of the markers used; Nec, cells expressing the necrotrophic marker PnprA’mcherryLGC only; Veg, cells expressing the vegetative growth marker PabrB’gfpBteAAV only; Nec+Veg, cells expressing both the vegetative growth and necrotrophic markers. Each symbol represents bacteria extracted from one larva. The dotted lines connect the mean values at each time point. These data are the result of two independent experiments.

