FIGURE 3.

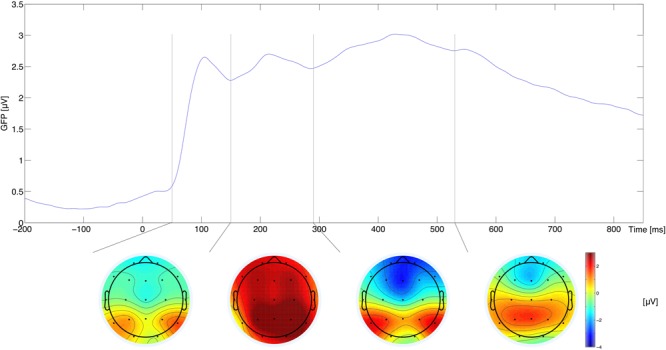
Global field power (upper plot) and topographies of average amplitude for a given time-window (bottom plot). The vertical lines in the upper plot indicate time window boundaries.

Global field power (upper plot) and topographies of average amplitude for a given time-window (bottom plot). The vertical lines in the upper plot indicate time window boundaries.