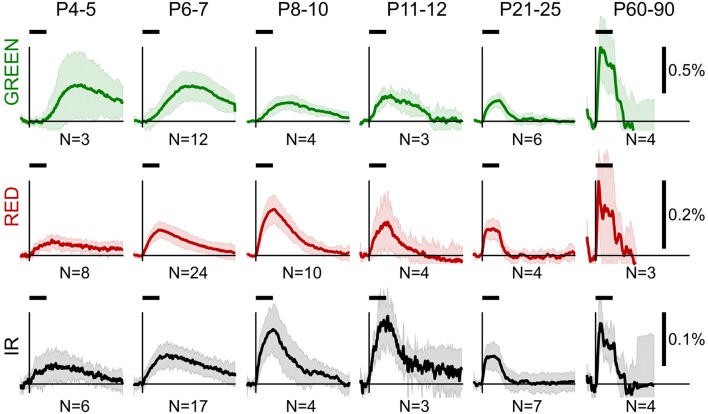
Figure 2.
Group average OIS in different spectra at different ages. Plots show average OIS recorded in the reflectance mode in different age groups (P4-5, P6-7, P8-10, P11-12, P21-25, P60-90) and different imaging spectra (GREEN, RED, and IR). A solid line depicts a group average and a shaded region—a group's standard deviation of individual OIS traces. Vertical lines indicate the stimulus onset and a horizontal bar above indicates the stimulation period. The group size is shown below each plot.

