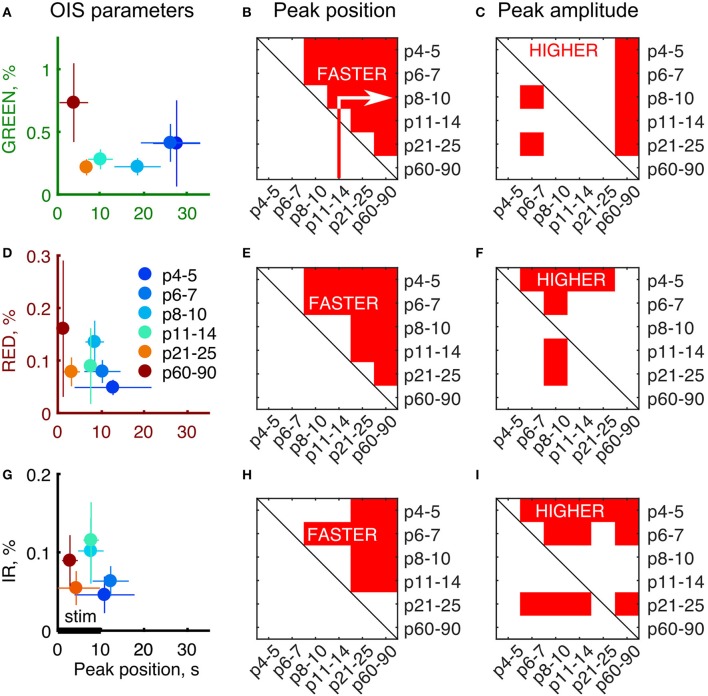
Figure 3.
Developmental profile of the OIS parameters. (A,D,G) Peak amplitudes vs. peak positions plot for each of the imaging spectra. Circle markers represent a group average and error lines—a group's standard deviation. Number of animals as in Figure 2. (B,E,H) Results of the one-tailed Mann-Whitney U-test for peak positions for each of the group pair combinations. Red areas are the conditions when peak positions in the X axis are significantly smaller than the ones in the Y axis (P ≤ 0.05) meaning that OIS develops faster in X rather than in Y. (C,F,I) Results of the one-tailed Mann-Whitney U-test for peak amplitudes for each of group combinations similarly to (B,E,H). Red areas are the conditions when peak amplitudes in the X axis are significantly higher than the ones in the Y axis (P ≤ 0.05) meaning that OIS is higher in X rather than in Y.

