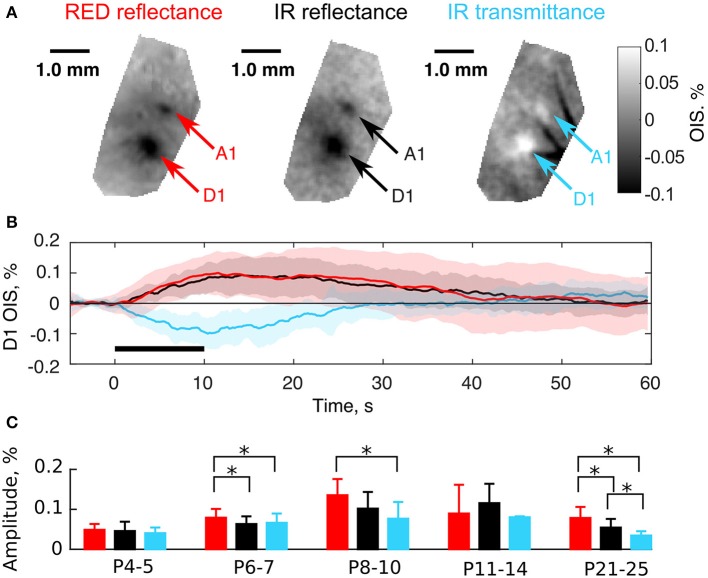
Figure 4.
Comparison of the transmission and the reflectance imaging modes in the neonatal rats. (A) Examples of OIS maps recorded in a P6 rat using RED reflected, IR reflected, and IR transmitted light. Arrows indicate OIS regions corresponding to the A1 and D1 barrels. (B) OIS time courses averaged in the D1 OIS region of (A). Solid lines represent trial-averaged OIS and the shaded region—standard deviation (Ntrials = 20). The black horizontal line depicts stimulation interval. Note that OISs are inverted in polarity (upwardly-directed signals correspond to darkening and downwardly-directed signals correspond to brightening). (C) Group statistics of OIS absolute amplitudes recorded in the reflectance and the transmission modes in different age groups. A bar height equals to a group average and error lines—to a group's standard deviation. Each group consists of at least three animals. The asterisk (*) represents significant differences in group amplitudes (Mann-Whitney U-test, P < 0.05).

