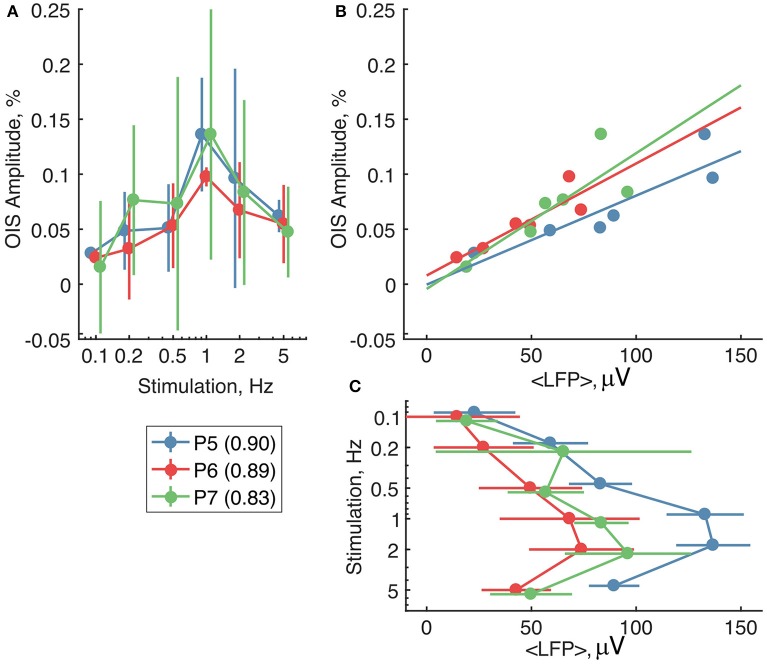
Figure 6.
The relationship between the RED OIS amplitude, average LFP (< LFP >), and stimulation frequency in the neonatal rats (P5-P7). (A,C) Dependence of the RED OIS amplitude and average LFP on stimulation rate. (B) The relationship between the RED OIS amplitude and average LFP. Circle markers represent group average and error lines—a group's standard deviation of values in trials (Ntrials = 12). The solid lines on (B) represent a linear regression of OIS amplitude vs. average LFP. Values of Pearson correlation coefficients for each experiment are shown in parentheses in the legend.

