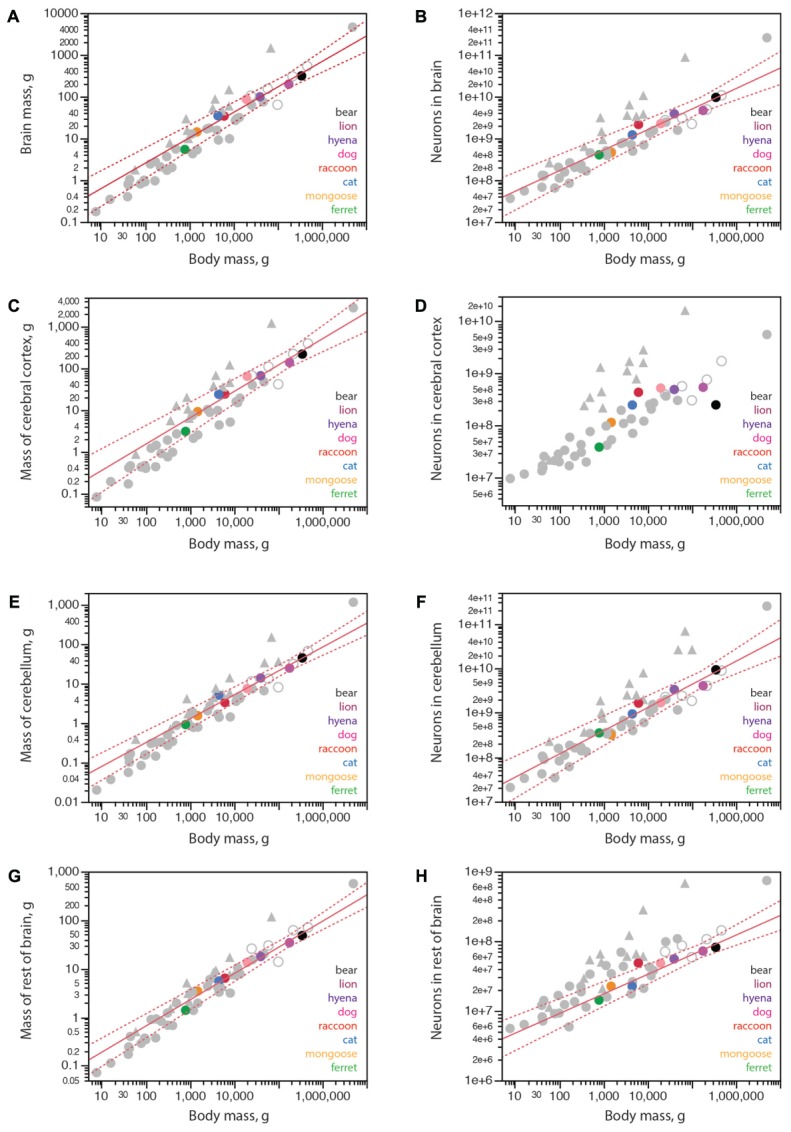
FIGURE 3.

Structure mass and number of neurons scale with body mass across carnivoran species, except for the number of neurons in the cerebral cortex. Plotted functions, in red, apply to carnivoran species and include the 95% confidence interval for the fit. Carnivoran species analyzed in this study are shown in colors according to the key in the graphs; non-carnivoran species are depicted in gray (primates in triangles, artiodactyls as unfilled circles). (A) Brain mass scales as a power function of body mass with exponent 0.608 ± 0.051 across carnivoran species (r2 = 0.959, p < 0.0001, n = 8, plotted), which is not significantly different from the exponent of 0.548 ± 0.038 that applies across artiodactyls (r2 = 0.990, p = 0.0048, n = 4), but is significantly lower than the exponent that applies across primates (0.903 ± 0.082, r2 = 0.931, p < 0.0001, n = 11). (B) The number of neurons in the brain scales as a power function of body mass with exponent 0.492 ± 0.054 across carnivoran species (r2 = 0.932, p = 0.0001, n = 8, plotted), which is indistinguishable from the exponent of 0.448 ± 0.115 that applies across artiodactyls (r2 = 0.884, p = 0.0598, n = 4), but is significantly lower than the exponent of 0.777 ± 0.091 (r2 = 0.889, p < 0.0001, n = 11) that applies across primates. (C) The mass of the cerebral cortex of carnivorans scales as a power function of body mass with exponent 0.631 ± 0.062 (r2 = 0.944, p < 0.0001, n = 8, plotted), which is not significantly different from the exponent that applies across artiodactyl species (0.589 ± 0.028, r2 = 0.995, p = 0.0023, n = 4), although smaller than the exponent that applies across primate species (0.942 ± 0.084, r2 = 0.926, p < 0.0001). (D) Whereas larger body mass is accompanied by larger numbers of cortical neurons in all other mammalian clades examined, larger carnivorans do not have ever growing numbers of cortical neurons. The lion and striped hyena have only as many cortical neurons as the average dog, which is only slightly more neurons than the raccoon, and the brown bear has even fewer cortical neurons, about as many as found in the cat. (E) The mass of the cerebellum scales as a power function of body mass with exponent 0.606 ± 0.042 across carnivorans (r2 = 0.972, p < 0.0001, n = 8, plotted), which is undistinguishable from artiodactyls (exponent, 0.612 ± 0.105, r2 = 0.944, p = 0.0282, n = 4), but lower than the exponent of 0.739 ± 0.074 (r2 = 0.900, p < 0.0001, n = 12) that applies to primates. (F) The number of neurons in the cerebellum scales as a power function of body mass with exponent 0.522 ± 0.056 (r2 = 0.935, p < 0.0001, n = 8, plotted), which overlaps with the power functions that apply to other clades except for primates (exponent, 0.754 ± 0.073, r2 = 0.906, p < 0.0001, n = 13) and for eulipotyphlans (exponent, 0.873 ± 0.088, r2 = 0.970, p = 0.0022, n = 5). (G) The mass of the rest of brain of carnivoran species scales as a power function of body mass with exponent 0.540 ± 0.035 (r2 = 0.976, p < 0.0001, n = 8, plotted), which overlaps with the power functions that apply to other clades except for primates (exponent, 0.706 ± 0.076, r2 = 0.896, p < 0.0001, n = 12). (H) The number of neurons in the rest of brain of carnivoran species scales as a power function of body mass with exponent 0.269 ± 0.042 (r2 = 0.872, p = 0.0007, n = 8), or 0.282 ± 0.028 without the raccoon (r2 = 0.953, p = 0.0002, n = 7, plotted), which has more neurons in the rest of brain than expected for body mass. Although the first exponent is not significantly different from the exponent that applies to artiodactyls (r2 = 0.227 ± 0.027, r2 = 0.973, p = 0.0136, n = 4), carnivoran species seem to have fewer neurons in the rest of brain than artiodactyls of similar body mass (unfilled circles).
