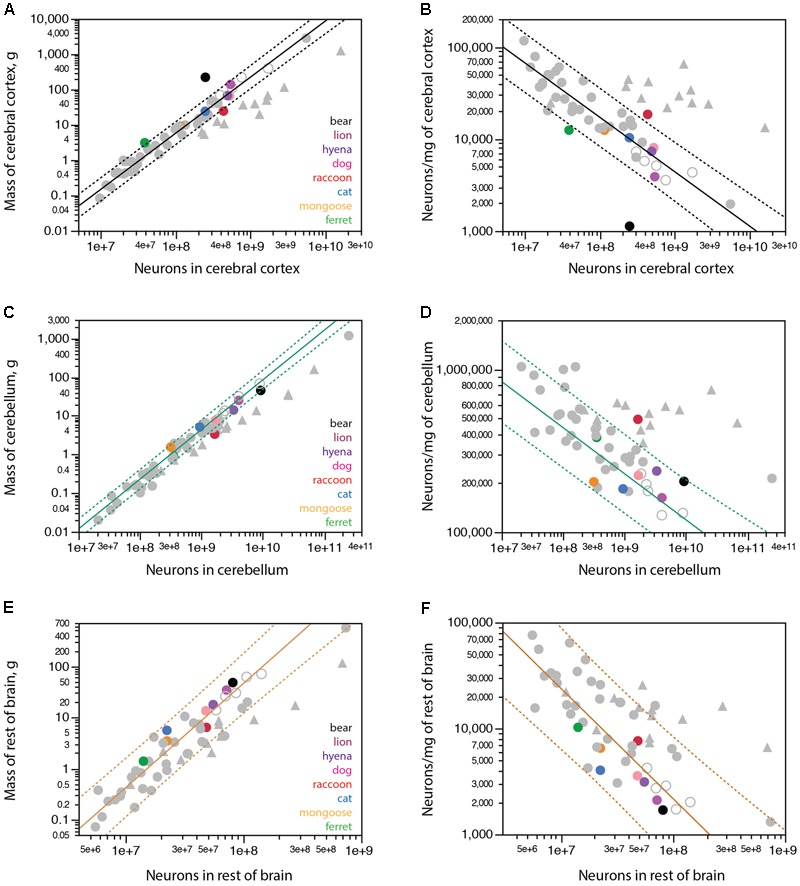
FIGURE 4.

Scaling of mass of brain structures with numbers of neurons in carnivorans. Carnivoran species analyzed in this study are shown in colors according to the key in the graphs; non-carnivoran species are depicted in gray (primates in triangles, artiodactyls as unfilled circles). Plotted functions apply to the species indicated for each graph and include the 95% confidence interval for individual values. (A) With the exception of the brown bear, ferret and raccoon, carnivoran species conform to the power function that describes how the mass of the cerebral cortex scales as a power function of the number of cortical neurons with exponent 1.588 ± 0.042 across non-primate, non-carnivoran species (r2 = 0.978, p < 0.0001, n = 35, plotted). The function calculated for carnivorans (without the bear and raccoon) has an exponent of 1.311 ± 0.136 (r2 = 0.959, p = 0.0006, n = 6). (B) Again, with the exception of the brown bear, ferret and raccoon, the density of neurons in the cerebral cortex of carnivoran species conforms to the power function that describes the scaling of neuronal density with the number of cortical neurons of exponent –0.590 ± 0.040 across non-primate, non-carnivoran species (r2 = 0.865, p < 0.0001, n = 35, plotted). (C) With the exception of the raccoon, carnivoran species conform to the power function that describes how the mass of the cerebellum scales as a power function of the number of cerebellar neurons with exponent 1.283 ± 0.035 across the ensemble of afrotherians (minus the African elephant), artiodactyls and glires (r2 = 0.987, p < 0.0001, n = 20, plotted). (D) With the exception of the raccoon, the density of neurons in the cerebellum of carnivoran species conforms to the power function that describes the scaling of neuronal density with the number of cerebellar neurons of exponent –0.283 ± 0.035 across the ensemble of afrotherians (minus the African elephant), artiodactyls and glires (r2 = 0.784, p < 0.0001, n = 20, plotted). However, the power function calculated for carnivoran species (minus the raccoon) fails to reach significance (p = 0.2918). (E) The power function that describes how the mass of the rest of brain scales with the number of rest of brain neurons across artiodactyls (minus the giraffe), eulipotyphlans and marsupials (exponent, 2.041 ± 0.143, r2 = 0.928, p < 0.0001; plotted) includes carnivoran species. (F) Carnivorans are aligned with the scaling of neuronal density in the rest of brain with the number of rest of brain neurons that applies to the ensemble of artiodactyls (minus the giraffe), eulipotyphlans and marsupials, with exponent –1.040 ± 0.142 (r2 = 0.769, p < 0.0001, n = 18, plotted).
