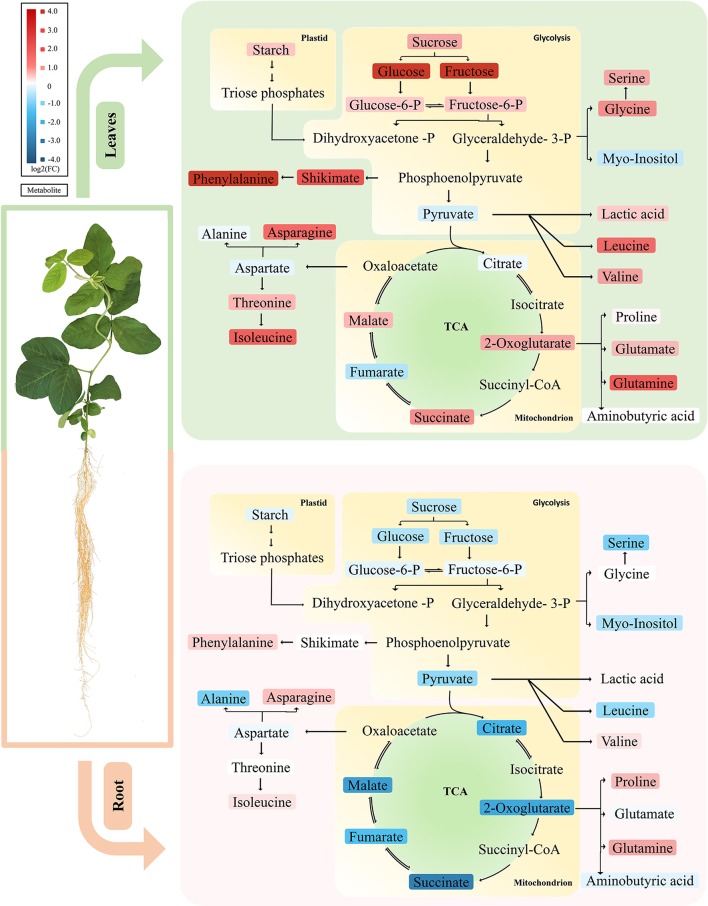
Figure 7.
Primary metabolic pathways responses to Mg deficiency in leaves and roots. Upper panel represents metabolic responses in Mg deficient leaves, in which most carbohydrate and amino acids are increased. Lower panel showed metabolic responses in Mg deficient roots, in which most carbohydrates and organic acids tend to decrease. The up-regulated metabolites are marked in red and the down-regulated metabolites in blue. Tones of red or blue indicate the value of fold change. Upper panel, leaves; lower panel, roots.

