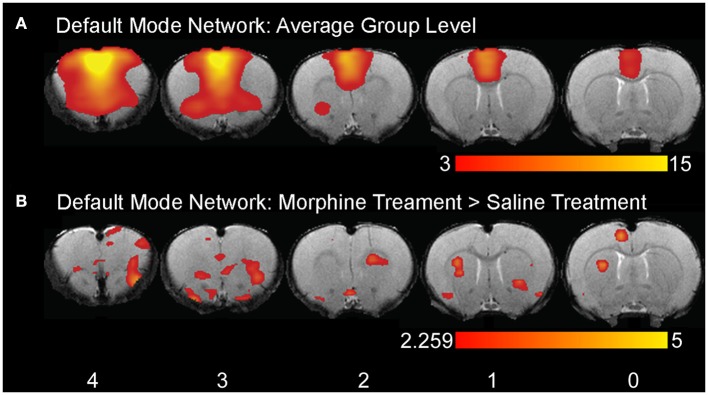
Figure 10.
Example of rodent resting-state network and cluster analysis. (A) Example of a group ICA spatial map. Specifically, this row of images illustrates the Default Mode Network at the group level. (B) Example of group-level differences between adult rat ICA spatial maps. It is an example of group level differences between rats previously treated with morphine or saline in early neonatal period. Melodic report spatial maps are presented as z-scores superimposed on mean functional image in radiological convention (right side of image corresponds to left side of brain). The numbers at the bottom (below each coronal section) refer to distance from Bregma (in mm).

