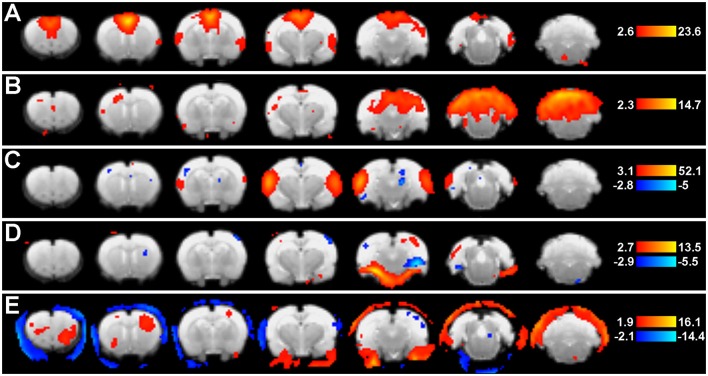
Figure 5.
Group ICA spatial maps. Figure shows representative group-level component spatial maps extracted from group ICA (Step 9: Network Detection via Group ICA) as they appear in the Melodic report, including pre-determined statistical thresholds (warm colors reflect positive z-scores, while cold colors reflect negative). Putative neural networks (A–C) show coherent BOLD signal predominantly arising from gray matter, while non-neuronal artefactual components (D,E) show a large degree of edges. Left side of image corresponds to right side of brain.

