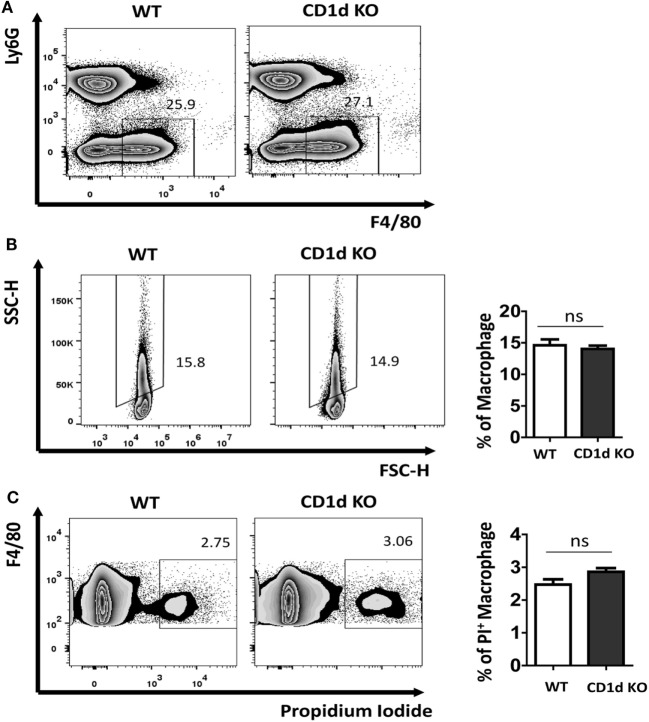
Figure 3.
Comparable monosodium urate (MSU) crystal phagocytosis in macrophage between wild-type (WT) and CD1d knockout (KO) mice. Flow cytometry first gated peritoneal macrophages (Ly6G−F4/80hi) (A) and then analyzed their side scatter (SSC) increase (B) and PI+ dead cells (C) at 6 h post-MSU crystal treatment. The bar graph showed the frequencies of SSC increased macrophages (B) and PI+ macrophages (C). Results are representative of three to four mice per group. Values are the mean and SEM. ns, not significant.

