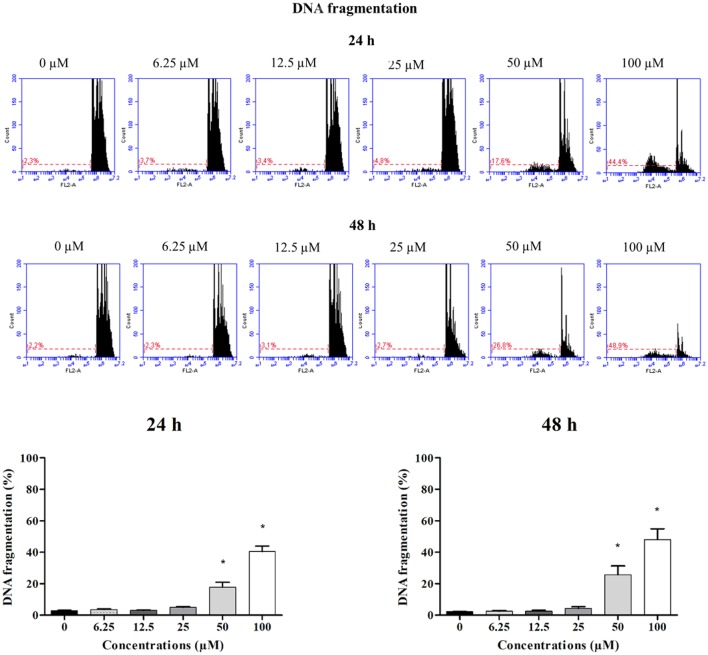
Figure 1.
DNA fragmentation in HepG2 cells treated with clopidogrel. Representative histograms and percentage of cells with fragmented DNA after treatment with clopidogrel (6.25, 12.5, 25, 50, and 100 μM) for 24 and 48 h. Data are shown as mean ± SEM of three independent experiments performed in triplicate and compared by Kruskal–Wallis ANOVA and pairwise comparisons by Mann–Whitney test. *p < 0.05 compared to control (vehicle, 0 μM clopidogrel).

