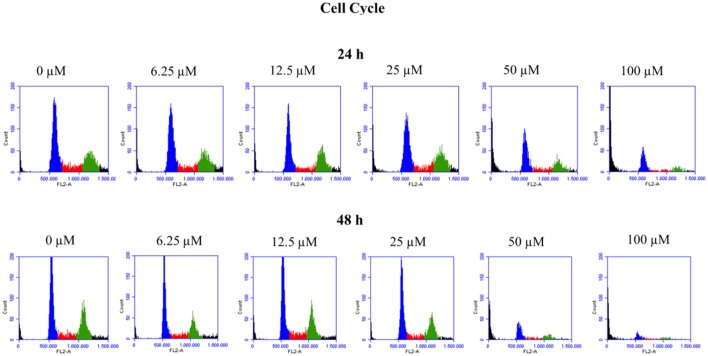
Figure 2.
Cell cycle profile of HepG2 cells treated with clopidogrel. Representative histograms of cells treated with clopidogrel (6.25, 12.5, 25, 50, and 100 μM) for 24 and 48 h. Blue: cells in the G0/G1 phase; Red: cells in the S phase; Green: cells in the G2/M phase. Data from 3 independent experiments performed in triplicate.

