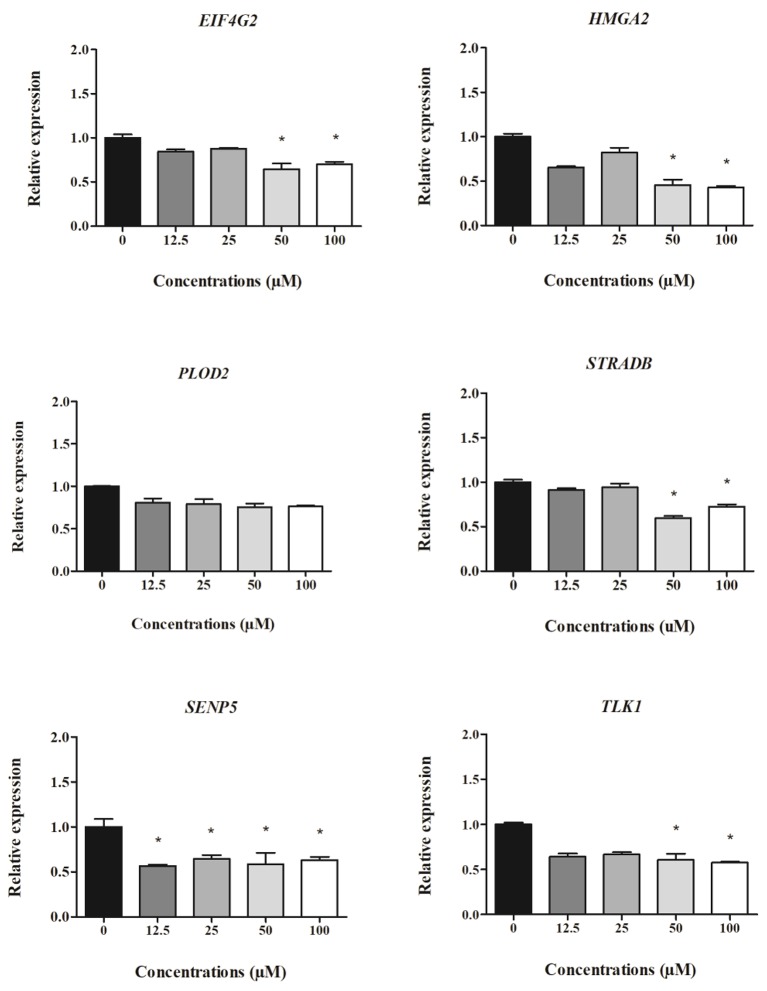
Figure 4.
Expression of cell-derived mRNAs in HepG2 cells after 24 h treatment with clopidogrel (12.5, 25, 50, and 100 μM). Data are shown as fold change (2−ΔΔCt) of clopidogrel-treated cells, using the vehicle (0 μM clopidogrel), as control and compared by Kruskal–Wallis ANOVA and pairwise comparisons by Mann–Whitney test. *p < 0.05 compared to control. Data from three independent experiments performed in duplicate.

