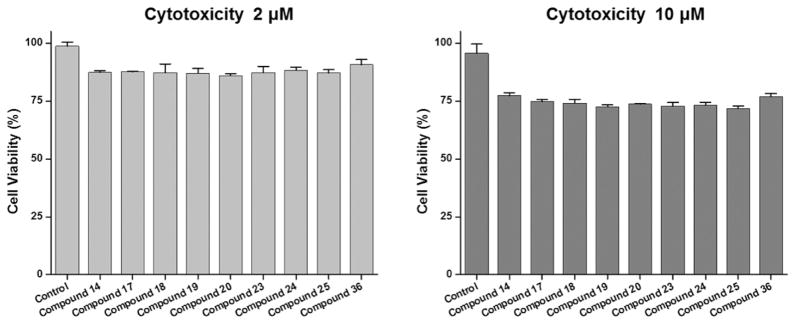
Figure 7.
Cell viability assay of selected NIR fluorophores using NIH/3T3 fibroblasts. Cell viability was plotted 1 day post-treatment of compounds at a concentration of 2 μM (left) or 10 μM (right), compared to untreated control as measured by the alamarBlue assay. Data are representative of N = 6 independent experiments per condition (mean ± SD).

