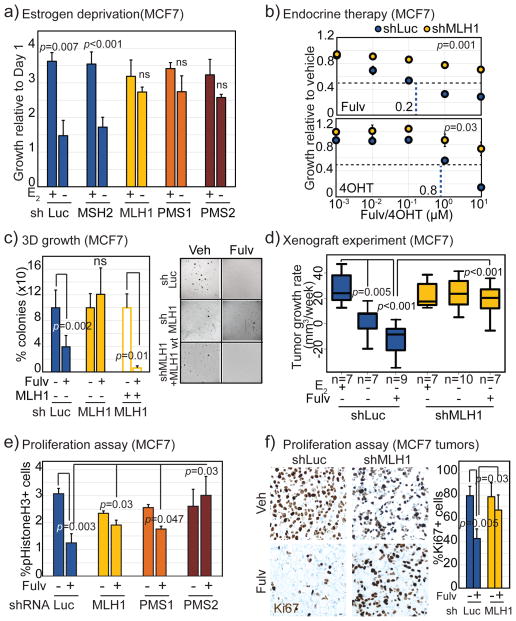
Figure 2. MutL deficiency induces endocrine therapy resistance in ER+ breast cancer cells by preventing proliferative block.
a) Bar graph depicting growth of MCF7 cells stably expressing shRNA against luciferase (control), MSH2, MLH1, PMS1 or PMS2, as indicated, at day 4 relative to day 1 after addition of 10nM beta-estradiol to cells grown in charcoal stripped serum for 4 days. Accompanying knockdown validation in Fig S2a+b, and estradiol dose curve in Fig S2c. b) Dose curves demonstrating increased growth of MCF7 cells stably expressing shRNA against MLH1 in response to increasing doses of 4-hydroxy tamoxifen (4-OHT) and fulvestrant (Fulv) relative to cells expressing shRNA against luciferase control. P-value describes significance of difference between slopes. c) Bar graph depicting percentage of colonies in soft agar (3D growth assay) generated from isotypic MCF7 cells with specified genotype after 4–6 weeks of endocrine treatment with accompanying representative images. Validation of rescue and 2D growth assay in Fig S3a. d) Boxplots depicting differences in tumor growth rate (calculated as slope from growth curve of each tumor) of MutL proficient (shLuc) vs deficient (shMLH1) MCF7 cells, in presence of estrogen (E2+) or placebo (E2−) in drinking water with or without weekly fulvestrant administration as indicated. Differences between the E2+ and E2−, and between the E2+ and E2−Fulv+ groups of shMLH1 tumors were non-significant (p>0.5). e+f) Bar graphs depict fold change in percentage of pHistoneH3+ (pH3, mitotic, e) and Ki67+ (proliferation marker, f) cells in MutL proficient (shLuc) and deficient (shMLH1, shPMS1, shPMS2, as indicated) ER+ breast cancer cells and tumors with representative images. Scale bar=20μm. Associated data for T47D cells in Figs S2+3. For all graphs, error bars describe standard deviation and Student’s t-test determined p-values.

