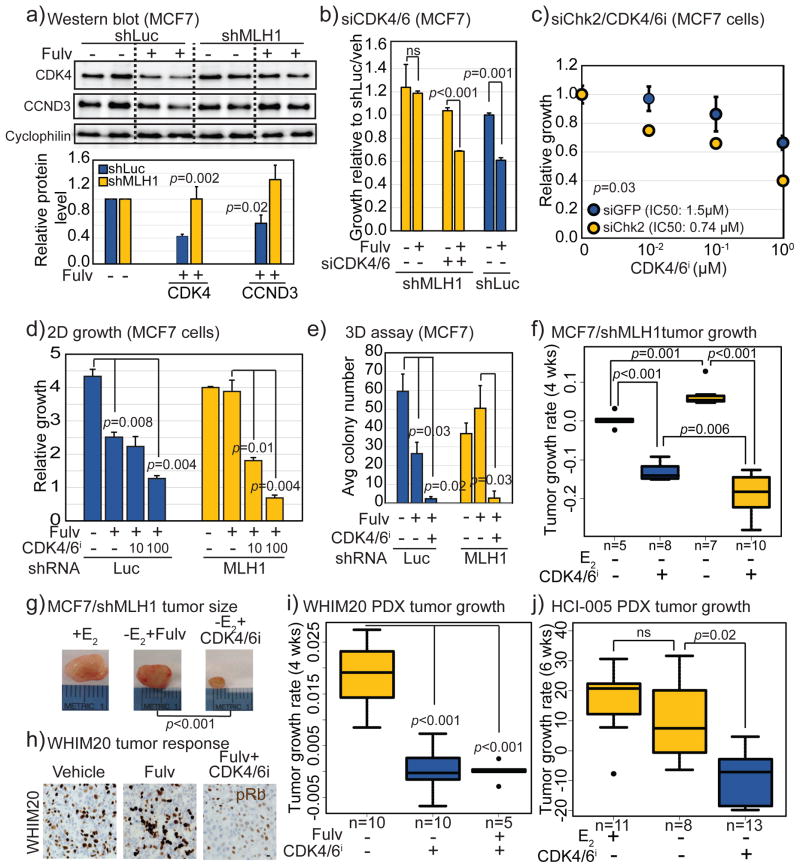
Figure 5. MutL deficient ER+ breast cancer cells upregulate CDK4 and are sensitive to CDK4/6 inhibitors.
a) Western blot confirming increased levels of CDK4 and CCND3 in shMLH1 MCF7 cells after fulvestrant treatment relative to shLuc cells with accompanying quantification. b–e) Graphs showing relative growth in 2D (b–d) and in soft agar (e), of parental MCF7 (b–c) and MCF7 shLuc and shMLH1 cells (d–e), treated with siCDK4/6 (b, validated in Fig S7d), siChk2 (c, validated in Fig 4c), and increasing doses of Abemaciclib, a CDK4/6 inhibitor, validated in Fig S7g (c–e), in combination with fulvestrant as indicated. f–j) Boxplots showing tumor growth rate of MCF7 shLuc and shMLH1 cells (f) with accompanying representative images of tumor size (g), and WHIM20, PMS2 mutant PDX (i) tumors with accompanying representative images of pRb immunohistochemistry (h), and HCI-005, PMS1 mutant PDX (j) treated as specified. Scale bar = 20μm. Student’s t-test generated all p-values except for (f+i+j) where ANOVA with Tukey comparson was deployed. Columns represent the mean and error bars denote standard deviation. Supporting data in Fig S7.

