
FIGURE 5.
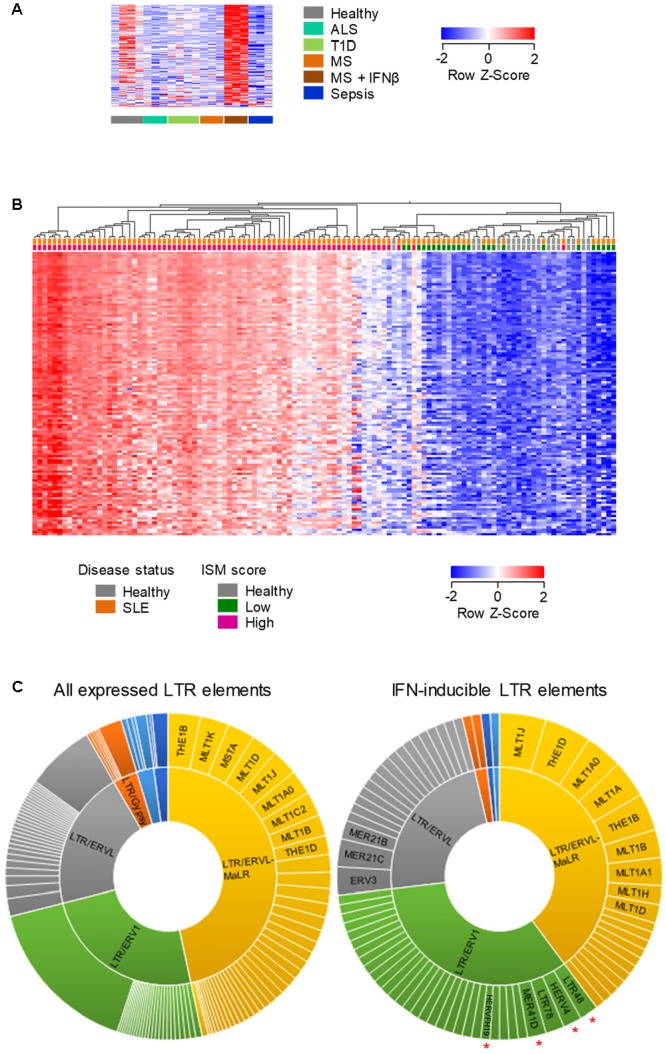
Human LTR elements induced by IFN I in whole-blood. (A) Expression profile of 131 LTR elements that are transcriptionally induced specifically by IFNβ treatment of MS patients, in whole-blood RNA-seq data (GSE60424). (B) Hierarchical clustering of healthy individuals and SLE patients according to the expression of 219 LTR elements that were induced in B cells by IFNβ treatment of MS patients and were also upregulated in RNA-seq data (GSE72420) from whole-blood samples from SLE patients as a group, compared with those from healthy individuals (≥2-fold change; p < 0.05). In (A,B) each column is an independent sample. (C) Diversity of the LTR elements that are expressed in peripheral blood cells (left) and of the 108 IFN I-inducible LTR elements that were common between purified B cells and whole-blood samples from IFNβ-treated MS patients and SLE patients. Slice widths are proportional to the frequency of each member. Significantly enriched groups (p < 0.05, χ2 with multiple comparison correction) are indicated by red asterisks.