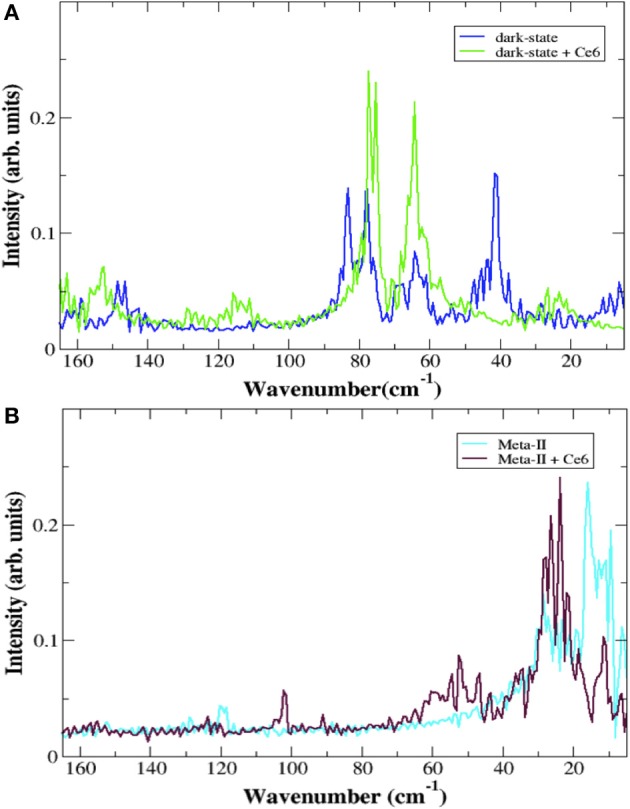
Figure 3.

The torsional spectrum of the retinal from rhodopsin MD simulations in (A) the dark-state (blue line) and in the dark-state when bound to Ce6 (green line) and (B) in Meta-II (cyan line) and Meta-II when bound to Ce6 (purple line). The peaks at 15 and 25 cm−1 in (B) are related to torsional fluctuations of the C-20 methyl group near the terminus of the polyene chain and a collective chain-twisting oscillation, respectively in Meta-II whereas the peak close to 60 cm−1 in (B) is associated with a chain torsion coupled with a retinal ring bending motion of a more inactive-type rhodopsin structure. In all cases, the torsion of the retinal is defined by the angle created by the C5-, C9-, and C13- methyl groups.
