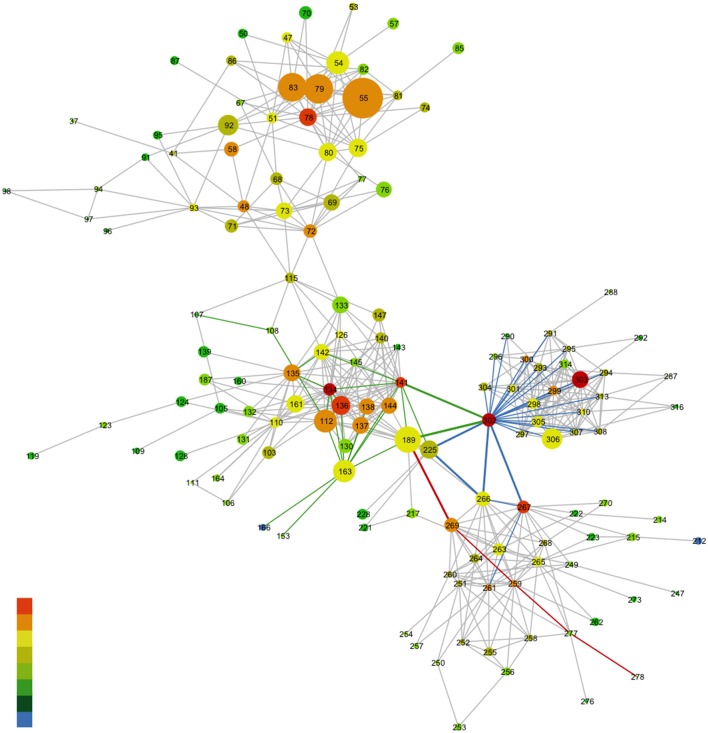
Figure 8.
Network representation of the MSA of the rhodopsin-like family of proteins. Nodes represent a specific amino acid and gray edges represent the lines between the nodes. The rainbow coloring of the nodes characterizes the degree to which a given amino acid takes part in the MI network (denoting coevolution propensity). Red nodes have a high MI value and blue nodes a low MI value. The size of the nodes in this case corresponds to the conservation of the amino acid from the MSA. The colored edges highlight the associations between specific nodes. For more details refer to Supplementary Text, Ce6 modulation of GPCR-A conserved allosteric sites in rhodopsin. The reference structure for the MSA is bovine rhodopsin (opsd_bovin) with pdb ID 1u19.

