
Figure 1.
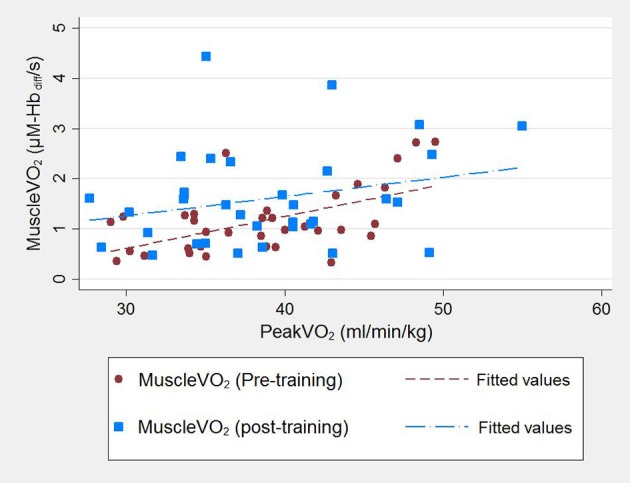
Correlationbetween cardio-pulmonary peakO2 and post-exercise muscleO2 for 27 participants assessed pre-training and post-training. Participant data pre-training are represented by red circles and a red line of best fit and post-training by blue squares and a blue line of best fit.