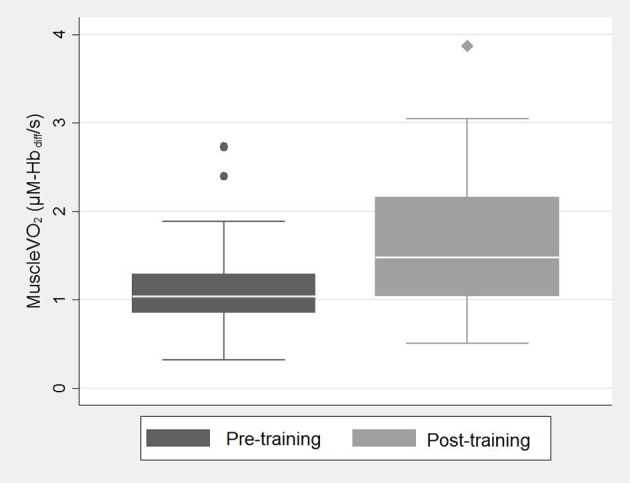
Figure 2.

Box and whisker plot showing post-exercise muscleO2 pre-training (dark gray) and post-training (light gray). A box and whisker plot is used to describe this data because of its skewed distribution. The bottom and top of the box represent the first and third quartiles, the band inside the box is the median and the whiskers represent the lower and upper adjacent values within 1.5*IQR of the lower and upper quartile, respectively. Medians were compared using a Wilcoxon signed-rank test; follow-up values were significantly higher than baseline.
