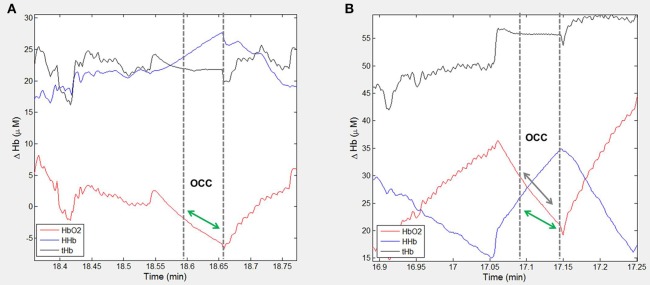
Figure 3.
Example participant data showing the NIRS signal during arterial occlusions (OCC) performed immediately post-exercise. Changes in oxygenated hemoglobin (HbO2), deoxygenated hemoglobin (HHb) and total hemoglobin (tHb) are shown for one participant at (A) pre-training visit and (B) post-training visit. The dashed lines indicate the measurement area and green arrow indicates the slope of decline in HbO2 which represents rate of oxygen consumption in the muscle. The green arrow is shown at both time-points to highlight the change with training.

