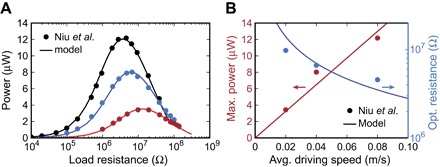
Fig. 5. Model fitting to experimental data from Niu et al. (19).

(A) Power change with respect to load resistance. Experimental data sets consist of driving conditions with average speeds of 0.08 m/s (black circles), 0.04 m/s (blue circles), and 0.02 m/s (red circles). Solid lines are from the ideal model by assuming a fixed 1/C* = 0.07, which determines the shape of the curve. The scaling of the model curve to real dimensions was determined by fitting due to the lack of experimental details in the study of Niu et al. (19). (B) The change of maximum power (left axis) and optimum resistance (for a fixed device capacitance; right axis) with respect to the average driving speed. The curves represent the expected scaling behavior of maximum power (, Eq. 7) and optimum load resistance (∝ 1/ω for fixed xmax;, Eq. 3) from the ideal model.
