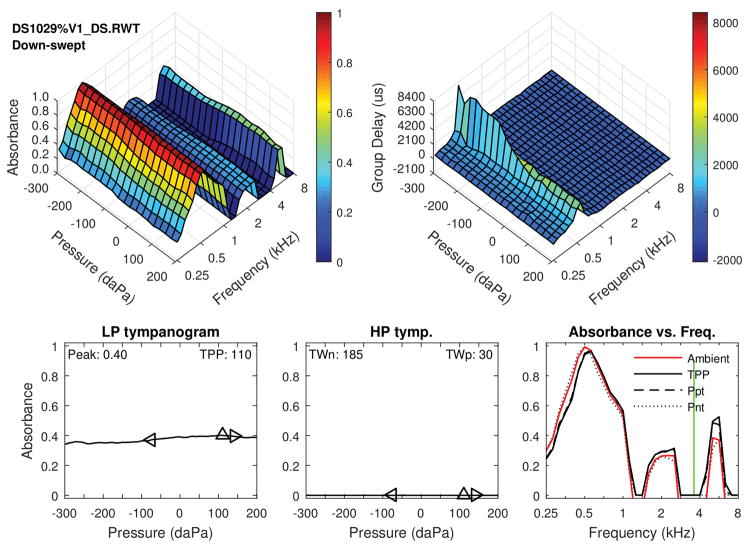
Figure 3.
The following figure shows individual case data for a patient with DS and patent PE tube. Note the high multiple peaks in the three dimensional tympanograms and ambient absorbance. Top left: Tympanometric absorbance (downswept pressure). Top right: Tympanometric GD. Bottom left: Average low-frequency tympanometry. Bottom middle: Average high-frequency tympanometry. Bottom right: Absorbance by frequency plots (at ambient, TPP, and the positive and negative tympanogram tails.)

