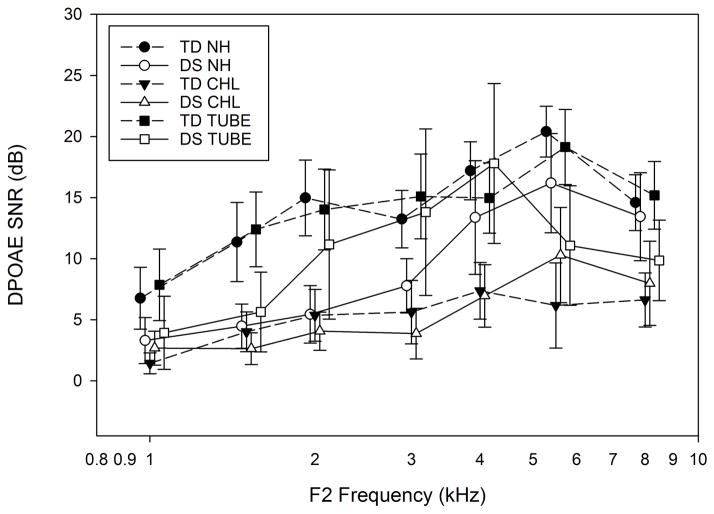
Figure 5.
Average DPOAE Signal to noise ratio (SNR) in each diagnostic category. The graph illustrates average SNR as a function of frequency. Error bars are ±1 SD. TD: typically developing; DS: Down syndrome; NH: normal hearing; CHL: conductive hearing loss; TUBE: pressure equalization tube. Symbols are jittered around the frequency to allow error bars to be visualized.

