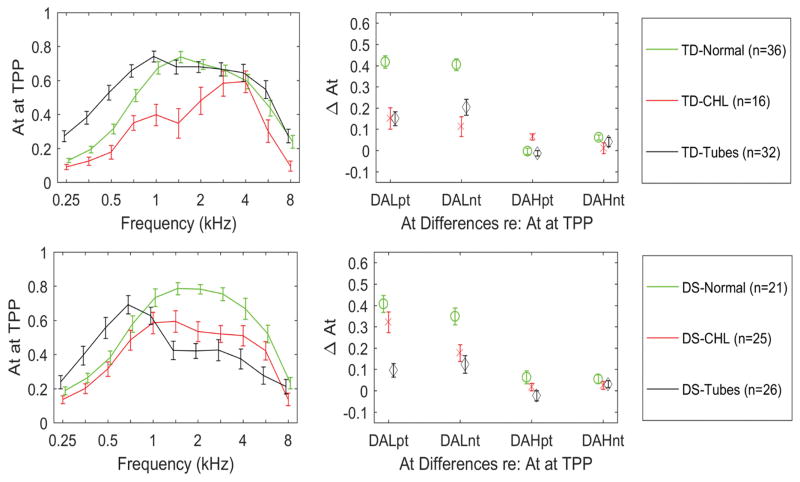
Figure 7.
Comparison of tympanometric absorbance at the TPP, in TD (top left panel) and DS (bottom left panel) for diagnostic categories of NH, CHL and patent PETs. The downswept averaged low frequency tympanograms, referenced to the positive (DALpt) and negative tail values (DALnt) are shown in the top right panels for the DS group, and bottom right panel for the TD group. The downswept averaged high frequency referenced to the positive (DAHpt) and negative tail values (DAHnt) are also shown for each category. Error bars are 95% CI.

