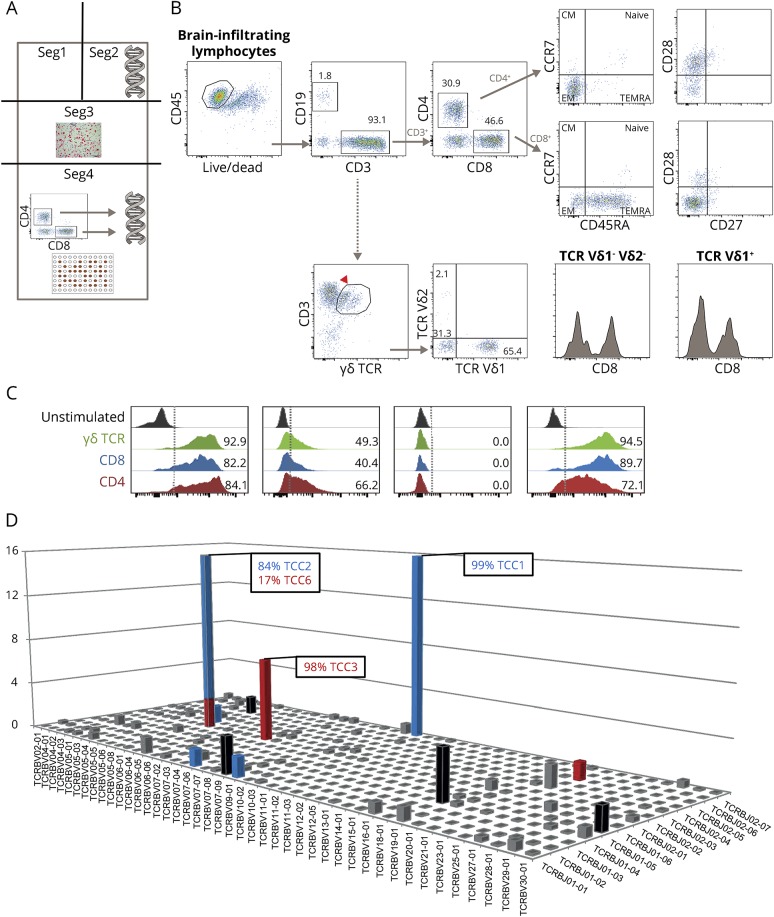
Figure 3. Methodological strategy, flow cytometric analysis, cytokine profile, and clonality of brain-infiltrating cells.
(A) Methodological strategy of dissecting the brain tissue (dimensions: 2 × 6 × 1.5 cm) for various analyses: segment (seg) 1 was kept for further analyses. Seg2 was taken for DNA extraction and subsequent high-throughput TCR sequencing. Seg3 was embedded in paraffin and used in immunohistochemical studies. Seg4 was used for isolation of brain-infiltrating mononuclear cells with subsequent (1) phenotypic analyses by flow cytometry, (2) expansion with phytohemagglutinin, FACS of CD4+ and CD8+ T cells, DNA extraction, and subsequent high-throughput TCR sequencing, and (3) T-cell cloning (TCC). (B) Flow cytometry analysis (seg4) of the brain-infiltrating mononuclear cells. (C) Cytokine profile of brain-infiltrating T cells. (D) High-throughput TCR sequencing (seg2) showing oligoclonal expansions of both CD4+ and CD8+ T-cell infiltrates. CM = central memory; EM = effector memory; TCR = T-cell receptor.

