Abstract
Purpose
Pterygium is a common degenerative and proliferative disease of the ocular surface. In some severe cases, pterygium may lead to irregular corneal astigmatism and corneal stromal scarring with visual impairment. The proliferative capacities of pterygial cells make them appear similar to tumorigenesis. Although considerable progress has been made towards understanding the etiology of the disease, the pathogenesis of pterygium has not been completely understood. In our previous study, we constructed pterygium-related lncRNA libraries by using microarray to investigate the potential roles of lncRNAs in pterygium. In this study, our objective was to explore the role of mRNA in pterygium.
Patients and methods
In this study, we constructed pterygium-related mRNA libraries by using microarray to investigate the potential roles of mRNAs in pterygium. Quantitative real-time PCR (qRT-PCR) was performed to validate some of the deregulated mRNAs in 10 patients.
Results
A total of 1485 upregulated and 2978 downregulated mRNAs were identified in pterygium tissues compared with paired adjacent normal conjunctival tissues (log fold change>2.0). qRT-PCR was performed to validate four overregulated and two underregulated mRNAs in 10 patients.
Conclusions
Our results reveal differentially expressed mRNAs in pterygium and suggest that mRNAs may be the novel molecular targets for therapy of pterygium.
Introduction
Pterygium is a common ocular surface disease characterized by a triangular-shaped growth consisting of fibrotic subconjunctival connective tissue and hypertrophy of the overlying conjunctival epithelium.1 Once the triangular-shaped growth covers the pupil, it becomes a significant sight-threatening complication. The biological mechanisms underlying pterygium are not well understood, and the only therapy employed when it affects vision is surgical removal.2 But recurrences are common. Based on the pterygium's propensity for growth, there have been investigations suggesting that pterygium may be a proliferative disorder rather than a degenerative process.1 Although considerable progress has been made toward understanding the etiology of the disease, the pathogenesis of pterygium has not been completely understood.3, 4There is a significant need to gain more insights into pterygium formation and recurrence in order to enable the design of new therapeutic strategies, for inhibiting pterygium growth, regressing pterygia, or preventing recurrence.5
In our previous study, we constructed pterygium-related lncRNA libraries by using microarray to investigate the potential roles of lncRNAs in pterygium. Quantitative real-time PCR (qRT-PCR) was performed to validate three overregulated and two underregulated lncRNAs in 10 patients. We reported, for the first time, that lncRNAs were differentially expressed in pterygium compared with paired adjacent normal conjunctival tissues.6
In this study, we hypothesized that the targeted mRNAs of pterygium-related lncRNAs might also be involved in the molecular pathogenesis of pterygium. To test this hypothesis, the global expression profiles of mRNAs were analyzed by using microarray and qRT-PCR in human pterygium compared to normal conjunctiva. Our results are likely to provide important insights into the pathogenesis of pterygium.
Materials and methods
Patient samples preparation
This clinical study was approved by the ethical review committee of the Second Affiliated Hospital of Nanjing Medical University. The surgical specimens were handled in accordance with the Declaration of Helsinki. Written informed consent for specimen collection and subsequent analysis was obtained from every enrolled participant. Twelve patients referred for elective pterygium surgery provided written informed consent and were included in the study. All patients were in good health and ranged from 49 to 79 years of age, comprising five males and seven females. Clinical and demographic information for the patients was shown in our previous paper.6 Conventional excision of pterygium with autotransplantation of a superotemporal conjunctival graft was carried out under local anesthesia. In the same patients, 1.5 × 1.5 mm of conjunctiva tissues were obtained from the inferior temporal quadrant of the bulbar conjunctiva during the surgery and served as control tissue. Clinical details pertaining to the study patients are described in Table 1 of our previous paper.6 Whole pterygial tissues, including pterygial head and body, were submitted to the analyses. All the locations of pterygial tissues we collected were nasal. All tissues were immediately frozen in liquid nitrogen and stored in a −80 °C freezer until use.
Table 1. Top 10 significantly differentially expressed mRNAs.
| Seqname | Gene symbol | Regulation | Fold change | P-value |
|---|---|---|---|---|
| ENST00000215531 | C19orf77 | up | 69.7435792 | 0.03739714 |
| NM_001005245 | OR5M11 | up | 66.3547482 | 0.003698218 |
| NM_002313 | ABLIM1 | up | 63.7124451 | 0.005113739 |
| NM_000451 | SHOX | up | 60.7777558 | 0.00645416 |
| NM_004828 | NCR2 | up | 54.5006866 | 0.03096669 |
| NM_001003443 | OR56A3 | up | 51.6560277 | 0.02631791 |
| NM_001007272 | DUSP13 | up | 50.1999544 | 0.002349316 |
| NM_001178097 | C12orf74 | up | 49.3215676 | 0.017149074 |
| ENST00000333082 | PSMF1 | up | 46.3302978 | 0.033824667 |
| NM_002314 | LIMK1 | up | 44.804016 | 0.014881755 |
| NM_017912 | HERC6 | down | 91.6195708 | 0.009542471 |
| NM_018847 | KLHL9 | down | 73.6666841 | 0.02165143 |
| NM_001001676 | LCN9 | down | 68.0751028 | 0.04796421 |
| NM_016529 | ATP8A2 | down | 67.2412715 | 0.049084569 |
| NM_006019 | TCIRG1 | down | 64.8387175 | 0.000474277 |
| NM_004999 | MYO6 | down | 63.0938027 | 0.023926299 |
| ENST00000367324 | PKP1 | down | 61.1732449 | 0.006679274 |
| NM_020854 | KIAA1468 | down | 57.3011683 | 0.018643498 |
| NM_201429 | RTN3 | down | 56.1974943 | 0.013278382 |
| NM_005908 | MANBA | down | 55.0688815 | 0.005347933 |
RNA extraction and quality control
To extract RNA from tissues, the frozen tissues were resuspended in TRIzol reagent (Life Technologies, Carlsbad, CA, USA) and finally eluted into 50 μl of elution solution according to the manufacturer’s instructions. We measured RNA quantity and quality using NanoDrop ND-1000 (NanoDrop Technologies, Wilmington, DE, USA), and assessed RNA integrity using standard denaturing agarose gel electrophoresis. All the RNA samples were stored at −80 °C until further processing. Complementary DNA (cDNA) was synthesized from 1 μg of total RNA by using a PrimesScript TM RT Master Mix Kit (TaKaRa, Dalian, China) with random hexamer primers in a final volume of 20 μl. The reverse transcription reactions were performed at 37 °C for 15 min, 85 °C for 5 s, and 4 °C for 10 min.
Microarray
Similar to our previous study,6 lncRNA microarray analysis, including labeling, hybridization, scanning, normalization, and data analysis, was performed by Shanghai KangChen Biotech. Co., Ltd. (Shanghai, China).
RNA labeling and array hybridization
RNA labeling and array hybridization were carried out according to the Agilent One-Color Microarray-Based Gene Expression Analysis protocol (Agilent Technologies, Santa Clara, CA, USA) with minor modifications. After removal of rRNA, mRNA was purified from total RNA (mRNA-ONLY Eukaryotic mRNA Isolation Kit, Epicentre, Madison, WI, USA). Each sample was amplified and transcribed into fluorescent cRNA along the entire length of the transcripts without 3′ bias, utilizing a mixture of oligo(dT) and random primers (Arraystar Flash RNA Labeling Kit, Arraystar, Rockville, MD, USA). Then, the labeled cRNAs were purified using the RNeasy Mini Kit (Qiagen, Hilden, Germany). The concentration and specific activity of the labeled cRNAs (pmol Cy3 per μg cRNA) were measured using NanoDrop ND-1000 (NanoDrop Technologies) and 1 μg of each labeled cRNA was fragmented by adding 5 μl 10 × blocking agent and 1 μl of 25 × fragmentation buffer. Then, the mixture was heated at 60 °C for 30 min and 25 μl of 2 × GE hybridization buffer was added to dilute the labeled cRNA. Then, 50 μl of hybridization solution was dispensed into the gasket slide and assembled to the lncRNA expression microarray slide. The slides were incubated for 17 h at 65 °C in an Agilent Hybridization Oven. Finally, the hybridized arrays were washed, fixed, and scanned using the Agilent DNA Microarray Scanner (part number G2505C; Agilent Technologies).
Quantitative real-time reverse-transcription PCR
The selected mRNAs and the primers (Supplementary Information I) used for qRT-PCR were designed and synthesized by Generay Biotech (Shanghai, China). We used β-actin as an internal control for tissue samples. qRT-PCR analysis was carried out using ViiA 7 Real-time PCR System (Applied Biosystems, Foster City, CA, USA) with SYBR expression assay system (TaKaRa). The conditions for PCR reaction were: an initial denaturation at 95 °C for 10 min, followed by 40 PCR cycles at 95 °C for 10 s and 60 °C for 60 s, finally annealing and extension at 95 °C for 10 s, 60 °C for 60 s, and 95 °C for 15 s. Each sample was assayed in triplicates. The standard curve method was used to determine the fold change in gene expression in the pterygium samples relative to the adjacent normal conjunctival samples.
Gene ontology (GO) enrichment
The Gene Ontology (GO) project (http://www.geneontology.org) provides a controlled vocabulary to describe gene and gene product attributes.7 GO categories were considered as significantly enriched only if the Fisher’s exact probability had a P-value<0.05.
Statistical analysis
We used Agilent Feature Extraction software (version 11.0.1.1) to analyze acquired array images. Quantile normalization and subsequent data processing were carried out by using the Gene Spring GX v12.1 software package (Agilent Technologies). mRNAs for which at least two out of four samples have flags in Present or Marginal (‘All Targets Value’) were chosen for further data analysis after quantile normalization of the raw data. Differentially expressed mRNAs with statistical significance between the two groups were identified through P-value or FDR filtering, and fold-change filtering. Hierarchical clustering and combined analysis were performed by using homemade scripts.
All experiments were repeated at least three times. All data were expressed as the mean±SEM. Statistical significance was analyzed by using SPSS 20.0 software package (SPSS Inc., Chicago, IL, USA). Differential expression levels of mRNAs were compared using independent-samples t-test between two groups. Fisher’s exact test was used in GO analysis. P<0.05 was considered statistically significant.
Results
Profile of microarray data
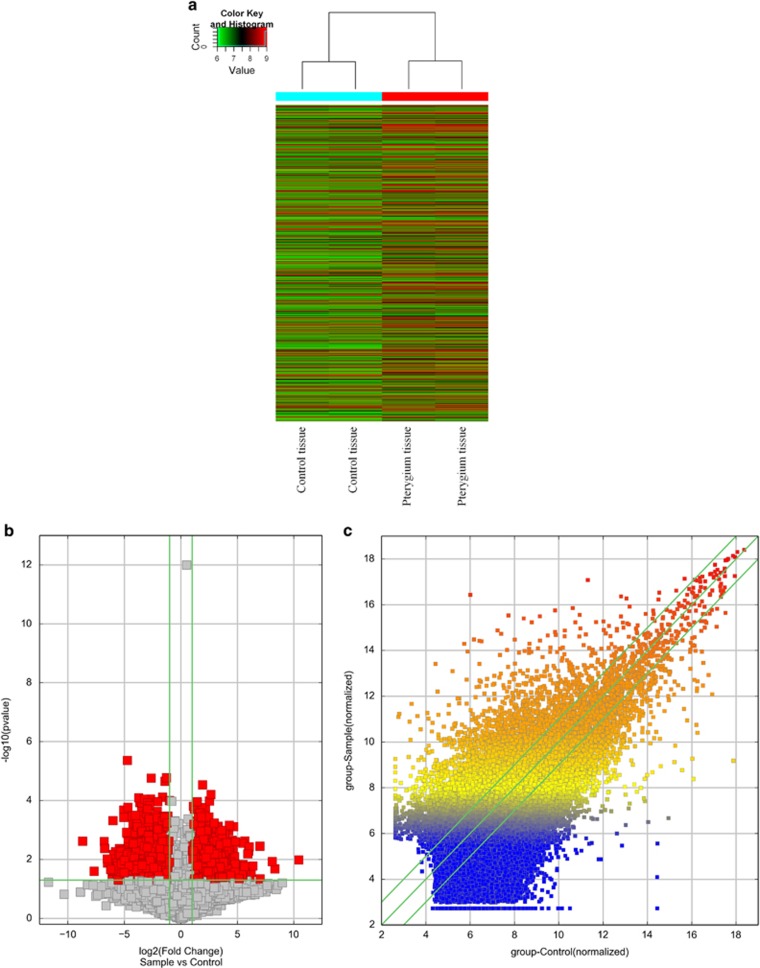
According to microarray expression profiling data, 21 360 mRNAs were detected. In addition, 4463mRNAs (log fold change>2.0) were found differentially expressed between pterygium samples and its paired adjacent normal conjunctival tissue samples (Table 1, Supplementary Information II). All these mRNAs were obtained from authoritative databases, RefSeq, GENCODE, and many related literatures. Hierarchical cluster shows mRNA expression patterns (Figure 1a). Scatter plot was used for assessing the mRNA expression variation between the two groups of pterygium and adjacent tissues (Figure 1b). In all 1485 upregulated and 2978 downregulated mRNAs were identified in pterygium tissues compared with paired adjacent normal conjunctival tissues. A volcano plot filtering between two groups initially revealed differentially expressed mRNAs with statistical significance (fold change>2.0, P<0.05) (Figure 1c).
Figure 1.
The differentially expressed profiling in pterygium was compared with paired adjacent normal conjunctival tissues. (a) Differentially expressed mRNAs in pterygium and paired adjacent normal conjunctival tissues were analyzed using hierarchical clustering. Hierarchical clustering analysis arranges samples into groups by expression level, ‘red’ indicates high relative expression, and ‘green’ indicates low relative expression. (b) The scatter plot is a visualization method used for assessing the mRNAs expression variations between pterygium and paired adjacent normal conjunctival tissues. The values of the X and Y axes in the scatter plot are the averaged normalized signal values of the group (log2 scaled). The green lines are fold change lines. (c) Volcano plot analysis of mRNA microarray data of differentially expressed mRNAs between pterygium and paired adjacent normal conjunctival tissues. The red points in the plot represent the differentially expressed mRNAs with statistical significance (fold change>2.0, P<0.05), while the vertical lines correspond to 2.0-fold up and down, and the horizontal line is P=0.05.
Real-time quantitative PCR confirmation
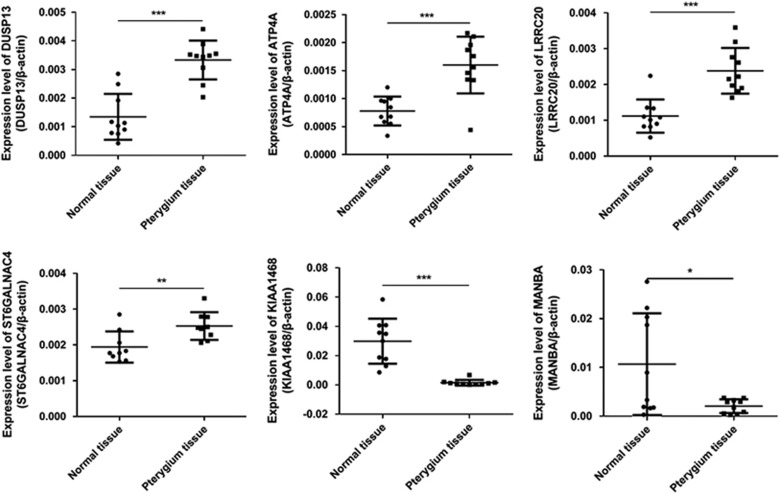
By using qRT-PCR, four upregulated mRNAs (DUSP13,ATP4A,LRRC20, and ST6GALNAC4) and two downregulated mRNAs (KIAA1468 and MANBA) with log fold changes >10 were randomly selected to test and verify the microarray data in 10 different samples of pterygium tissues and paired adjacent normal conjunctival tissues (Figure 2). The qRT-PCR results and microarray data are consistent. Thus, microarray data profiling indicated a series of mRNAs constantly differentially expressed between pterygium tissues and paired adjacent normal conjunctival tissues.
Figure 2.
The differential expression of mRNAs between pterygium and paired adjacent normal conjunctival tissues were validated by qRT-PCR. *P<0.05, **P<0.01, ***P<0.001.
Expression signatures of deregulated mRNAs between pterygium tissues and paired adjacent normal conjunctival tissues
As mRNA expression is tissue specific, to further study the mRNA expression pattern in pterygium tissues, we first investigated general signatures of deregulated mRNAs with log fold changes >2.0, including mRNA length distribution and chromosome distribution. Classification analysis showed that most mRNAs in our microarray are distributed across 2001–3000 nt length (Supplementary Information III A). Chromosome distribution showed that up- and downregulated mRNAs have different chromosome locations (Supplementary Information III B).
GO analysis
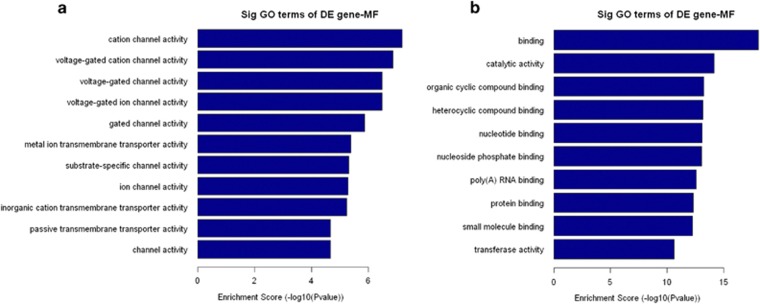
GO analysis was performed to determine the gene and gene product enrichment, which covered three domains: biological processes, cellular components, and molecular functions. Fisher’s exact test was used to determine whether the overlap between the differentially expressed gene list and the GO annotation list was greater than that expected by chance (a P-value <0.05 is recommended). In our previous study, we found that the highest GO classification targeted by overregulated transcripts comprised the single-organism process (ontology: biological process), membrane (ontology: cellular component), and protein binding (ontology: molecular function). Meanwhile, the highest GO classification targeted by the underregulated transcripts consisted of the cellular process (ontology: biological process), cell part (ontology: cellular component), and binding (ontology: molecular function). To analyze the candidate molecular functions of mRNAs, we enriched the molecular functions of both up- and downregulated mRNAs. It is interesting that most molecular functions of upregulated mRNAs are involved in proliferation and differentiation, such as cation channel activity, voltage-gated cation channel activity, gated channel activity, and substrate-specific channel activity, which shows that upregulated mRNAs in pterygium tissues have a close association with proliferation and differentiation (Figure 3a). On the contrary, we found the molecular functions of downregulated mRNA to be enriched in binding, catalytic activity nucleotide binding, and protein binding (Figure 3b).
Figure 3.
GO analysis. The top 10 GO terms that associated with coding gene functions of upregulated mRNAs (a) and downegulated mRNAs (b) are listed.
Discussion
Pterygium is a progressively growing fibrovascular tissue mass originating outside the cornea, which often invades the optical axis. In some severe cases, pterygium may lead to irregular corneal astigmatism and corneal stromal scarring with visual impairment.8 Environmental conditions may be involved in establishing the conditions on the ocular surface that allow the development of primary pterygium, ultraviolet light exposure, and other conditions that produce chronic irritation of the eye. Indeed, pterygium tissue shares the features of many pre-malignant tissues, including epithelial proliferation, goblet cell hyperplasia, angiogenesis, inflammation, and elastosis.9, 10 However, the mechanisms of pterygium formation have not been fully clarified. Figuring out the expression profile of mRNAs in pterygium is critical in understanding its pathogenesis.
Recent microarray analysis has demonstrated that microRNAs (miRNAs) and their targeted mRNAs are functionally important in processes relevant to pterygium pathogenesis.11The concerted upregulation of miR-221 was known to regulate downstream p27Kip1 gene expression,8 and evidence showed that miR-200 family was a potential regulator of EMT in pterygium.11 The proliferative capacities of pterygial cells have a mechanism similar to tumorigenesis. However, the roles of pterygium pathogenesis still remain unclear.
In the present study, we investigated the mRNA expression profiles of pterygium using microarray analysis and found that the mRNAs expression levels were altered compared to adjacent normal conjunctival tissues. From the microarray expression profiles, we found that 1485 upregulated and 2978 downregulated mRNAs were significantly differentially expressed (>2.0-fold) in all pterygium samples. Six mRNAs were evaluated by qRT-PCR to validate the consistency. The qRT-PCR results and microarray data are consistent. The mRNA changes were observed both in pterygial stroma and epithelium, all of which expressed proliferative features compared to normal conjunctival tissues.
For pterygium, genetic mutations in developmental genes were common, as observed in other proliferative diseases such as cancers. An overregulated mRNA, ATP4A, was identified in a previous study to be closely correlated with the carcinogenesis of gastric cancer. It was considered a potential driver gene whose targets were seen to be involved in cell adhesion, angiogenesis, cell proliferation, and apoptosis.12 The proliferative feature of ATP4A may help us learn more about the relationship between pterygium and mRNAs at the transcriptional level.
To analyze the candidate molecular functions of mRNAs, we enriched the molecular functions of both up- and downregulated mRNAs. The results indicate that most molecular functions of upregulated mRNAs, such as cation channel activity, voltage-gated cation channel activity, gated channel activity, and substrate-specific channel activity, are involved in proliferation and differentiation, which shows that upregulated mRNAs in pterygium tissues are closely related to proliferation and differentiation. This is the first report showing that pterygium-related mRNAs are associated with proliferation and differentiation by microarray. Meanwhile, we found the molecular functions of downregulated mRNA are enriched in binding, catalytic activity nucleotide binding, and protein binding.
In conclusion, we report for the first time that pterygium is associated with significant changes in expression of multiple mRNAs. Some of the changes identified in this study suggest new mechanisms potentially relevant in the formation of pterygium. In the future, we will expand the number of enrolled patients and apply immunofluorescence, proteomics, or protein-level quantification of the mRNA targets in patients with pterygium staged according to severity level. Further investigation will help to evaluate the relevance of these mRNAs in the pathogenesis of pterygium, and their potential as biomarkers, molecular targets, and prognosis markers in the medical treatment of pterygium.

Acknowledgments
The authors wish to thank Dr Chun Lu for his help with the techniques and critical review of this manuscript.
Footnotes
Supplementary Information accompanies this paper on Eye website (http://www.nature.com/eye)
The authors declare no conflict of interest.
Supplementary Material
References
- Kim KW, Park SH, Kim JC. Fibroblast biology in pterygia. Exp Eye Res 2016; 142: 32–39. [DOI] [PubMed] [Google Scholar]
- Wong YW, Chew J, Yang H, Tan DT, Beuerman R. Expression of insulin-like growth factor binding protein-3 in pterygium tissue. Br J Ophthalmol 2006; 90(6): 769–772. [DOI] [PMC free article] [PubMed] [Google Scholar]
- Bradley JC, Yang W, Bradley RH, Reid TW, Schwab IR. The science of pterygia. Br J Ophthalmol 2010; 94(7): 815–820. [DOI] [PubMed] [Google Scholar]
- Chui J, Di Girolamo N, Wakefield D, Coroneo MT. The pathogenesis of pterygium: current concepts and their therapeutic implications. Ocul Surf 2008; 6(1): 24–43. [DOI] [PubMed] [Google Scholar]
- Al-Swailem S, Xu Z, Wu L, Hartsock MJ, Yiu SC, Duh EJ. Induction of endothelial RAGE expression in pterygium. Mol Vis 2014; 20: 1740–1748. [PMC free article] [PubMed] [Google Scholar]
- Liu J, Ding X, Yuan L, Zhang X. Identification of pterygium-related long non-coding RNAs and expression profiling by microarray analysis. Int J Mol Med 2016; 38(2): 529–536. [DOI] [PubMed] [Google Scholar]
- Huntley RP, Harris MA, Alam-Faruque Y, Blake JA, Carbon S, Dietze H et al. A method for increasing expressivity of Gene Ontology annotations using a compositional approach. BMC Bioinformatics 2014; 15. [DOI] [PMC free article] [PubMed]
- Wu CW, Cheng YW, Hsu NY, Yeh KT, Tsai YY, Chiang CC et al. MiRNA-221 negatively regulated downstream p27Kip1 gene expression involvement in pterygium pathogenesis. Mol Vis 2014; 20: 1048–1056. [PMC free article] [PubMed] [Google Scholar]
- Chui J, Coroneo MT, Tat LT, Crouch R, Wakefield D, Di Girolamo N. Ophthalmic pterygium: a stem cell disorder with premalignant features. Am J Pathol 2011; 178(2): 817–827. [DOI] [PMC free article] [PubMed] [Google Scholar]
- Tung JN, Chiang CC, Tsai YY, Chou YY, Yeh KT, Lee H et al. CyclinD1 protein expressed in pterygia is associated with beta-catenin protein localization. Mol Vis 2010; 16: 2733–2738. [PMC free article] [PubMed] [Google Scholar]
- Engelsvold DH, Utheim TP, Olstad OK, Gonzalez P, Eidet JR, Lyberg T et al. miRNA and mRNA expression profiling identifies members of the miR-200 family as potential regulators of epithelial-mesenchymal transition in pterygium. Exp Eye Res 2013; 115: 189–198. [DOI] [PMC free article] [PubMed] [Google Scholar]
- Li ML, Li SG, Wu WG, Rao LH, Zhang L, Ding QC et al. [Differential gene expression profiles of gastric cancer]. Zhonghua Yi Xue Za Zhi 2012; 92(18): 1249–1252. [PubMed] [Google Scholar]
Associated Data
This section collects any data citations, data availability statements, or supplementary materials included in this article.


