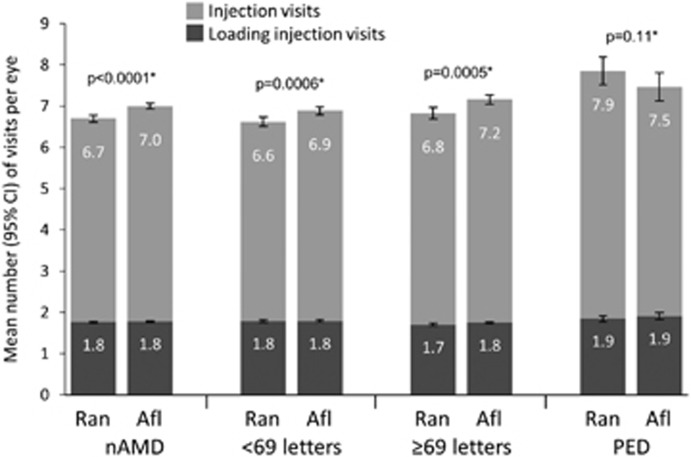
Figure 4.
Mean number of injection visits per eye during 12 months of follow-up. *P-values derived from a two-sided Wilcoxon rank-sum test and refer to injection visits. Error bars are 95% confidence intervals. nAMD, neovascular age-related macular degeneration; NIV, non-injection visits; PED, retinal pigment epithelial detachment.

