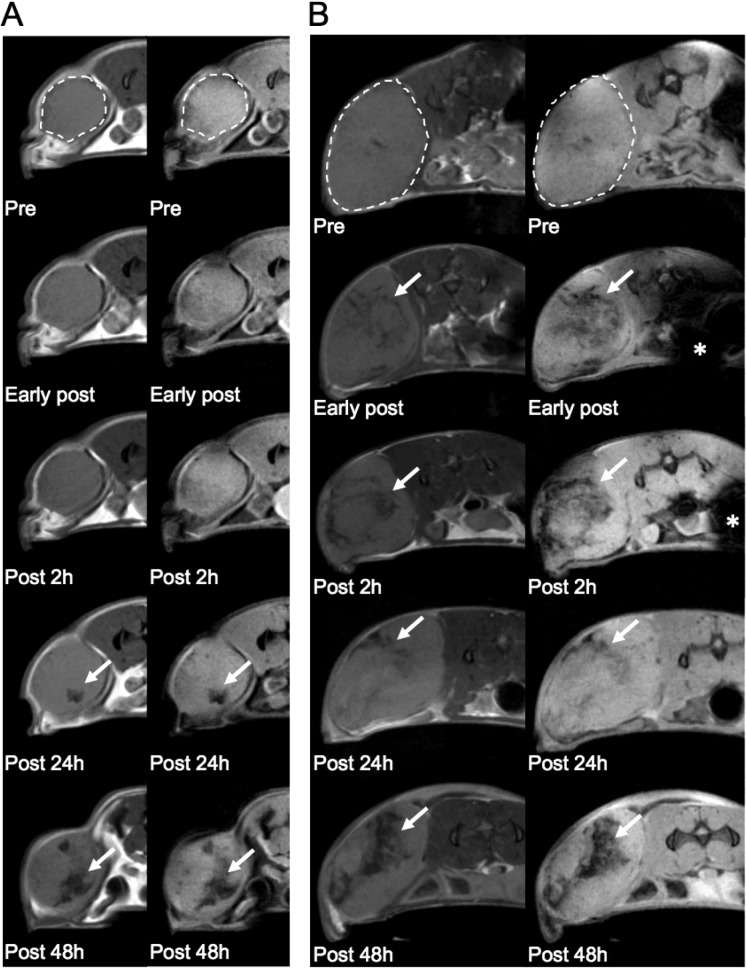
Figure 4.
In vivo tumor targeting. (A) Representative T2 (left line) and T2*w (right line) images obtained by i.v. injection, in a mouse bearing subcutaneous tumors, and using EGF-NPFe at 24 mg/kg. Arrows indicate areas of signal drop at long time point after injection. (B) Representative T2 (left line) and T2*w (right line) images obtained by i.p. injection. Dashed lines in pretreatments (Pre) delineate tumor margins. Asterisks show the injection site.

