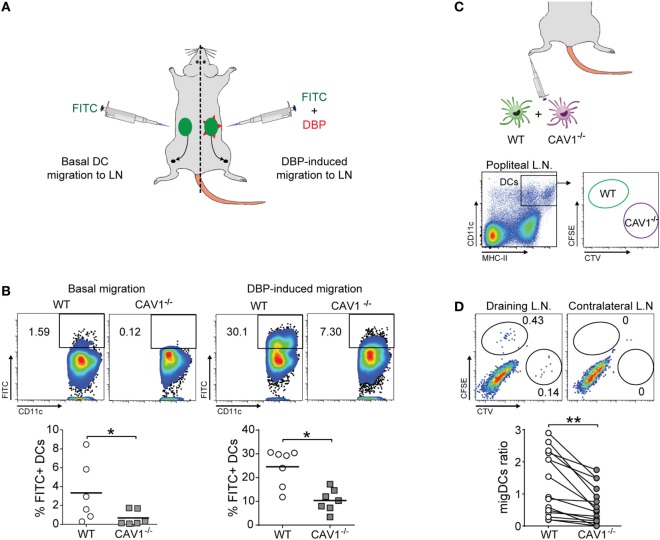
Figure 2.
Caveolin-1 (CAV1) favors dendritic cell (DC) trafficking to lymph nodes (LNs) in vivo (A,B). Back skin of wild-type (WT) and CAV1−/− mice were treated with FITC (left flank) or FITC + dibutyl phthalate (DBP) (right flank), as summarized in (A). (B) After 24 h, the arrival of skin-derived FITC+ DCs to inguinal LNs was evaluated. Representative density plots (top panels) and quantification of FITC+ DCs (bottom panels) under basal or DBP-induced conditions are shown. Each dot represents one animal, and the bar is the mean (*p < 0.05, n = 7). (C,D) WT and CAV1−/− bone marrow-derived DCs (BM-DCs) were stained with CFSE and Cell Trace Violet (CTV), respectively. Then, WT recipient mice were subcutaneously injected in the right footpad with 5 × 10⁵ cells (1:1 ratio, WT to CAV1−/−) or with PBS as a control (left footpad). The arrival of CFSE (WT) or CTV (CAV1−/−) BM-DCs to the draining (right) and contralateral (left) popliteal LNs was evaluated 24 h later. (C) Scheme of footpad injection and gating analysis to analyze transferred BM-DCs. (D) Representative dot plots of DCs in the draining popliteal LNs are shown. Gates showing injected WT and CAV1−/− DCs are displayed. The migration index of WT or CAV1−/− DCs was calculated as {[% CTV stained DC in popliteal lymph nodes (PLN)]/(% CTV stained DC in input)}/[(% CFSE WT DC in PLN)/(% CFSE WT DC in input)]. Data are presented as dot plots with connecting lines per paired samples. **p < 0.01, n = 16 mice, from three independent experiments.

