
FIGURE 3.
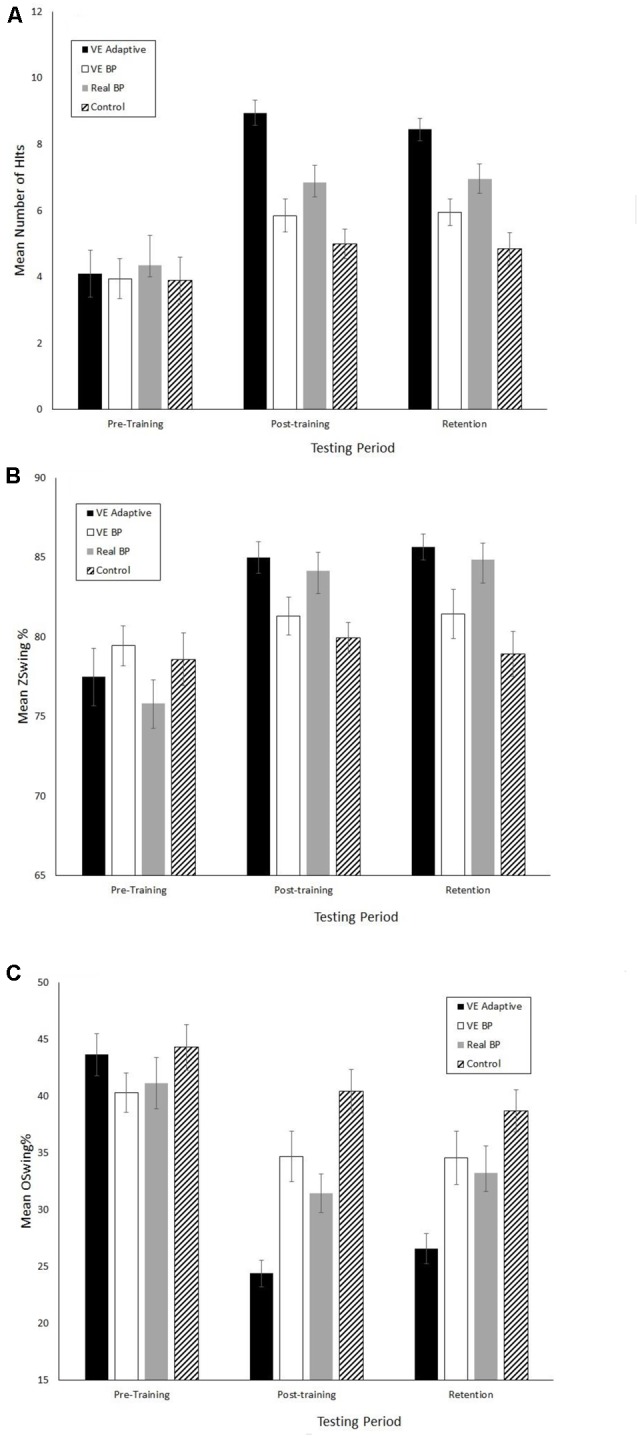
Mean performance scores for the real batting tests. (A) Number of hits. (B) Z-Swing %. (C) O-Swing %. Error bars are standard errors.
Official websites use .gov
A
.gov website belongs to an official
government organization in the United States.
Secure .gov websites use HTTPS
A lock (
) or https:// means you've safely
connected to the .gov website. Share sensitive
information only on official, secure websites.
Mean performance scores for the real batting tests. (A) Number of hits. (B) Z-Swing %. (C) O-Swing %. Error bars are standard errors.