. 2017 Oct 27;39:e2017047. doi: 10.4178/epih.e2017047
©2017, Korean Society of Epidemiology
This is an open-access article distributed under the terms of the Creative Commons Attribution License (http://creativecommons.org/licenses/by/4.0/), which permits unrestricted use, distribution, and reproduction in any medium, provided the original work is properly cited.
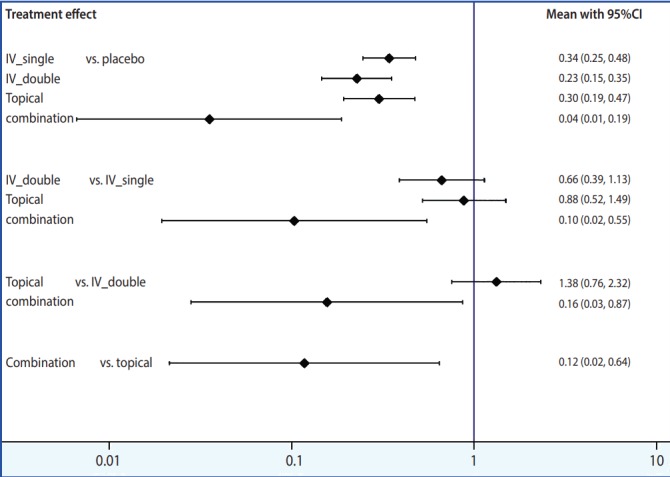
Figure 5.

Interval plot. CI, confidence interval.
