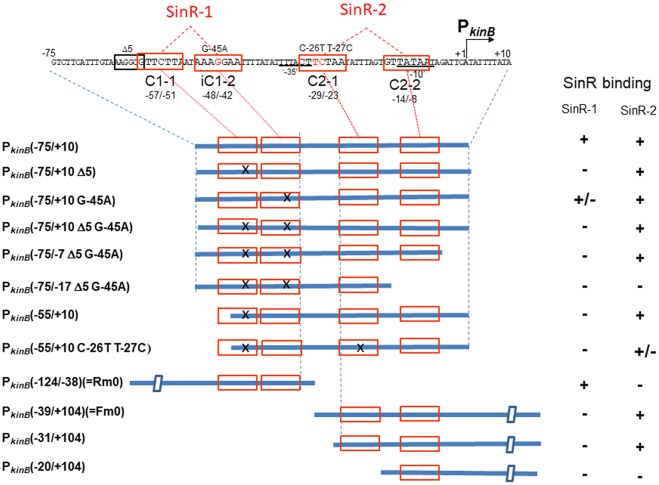
FIGURE 8.
Deletion analysis to localize SinR-binding sites (SinR-1 and SinR-2) by EMSA. (Top) The nt sequence of the PkinB region (nt –75/+10), where SinR-1 (C1-1 and iC1-2) and SinR-2 (C2-1 and C2-2) are localized, is shown. The EMSA probes cover various PkinB regions indicated by thick blue bars where SinR consensus sequences (red boxes) are shown; X means a defective consensus sequence.

