Figure 3.

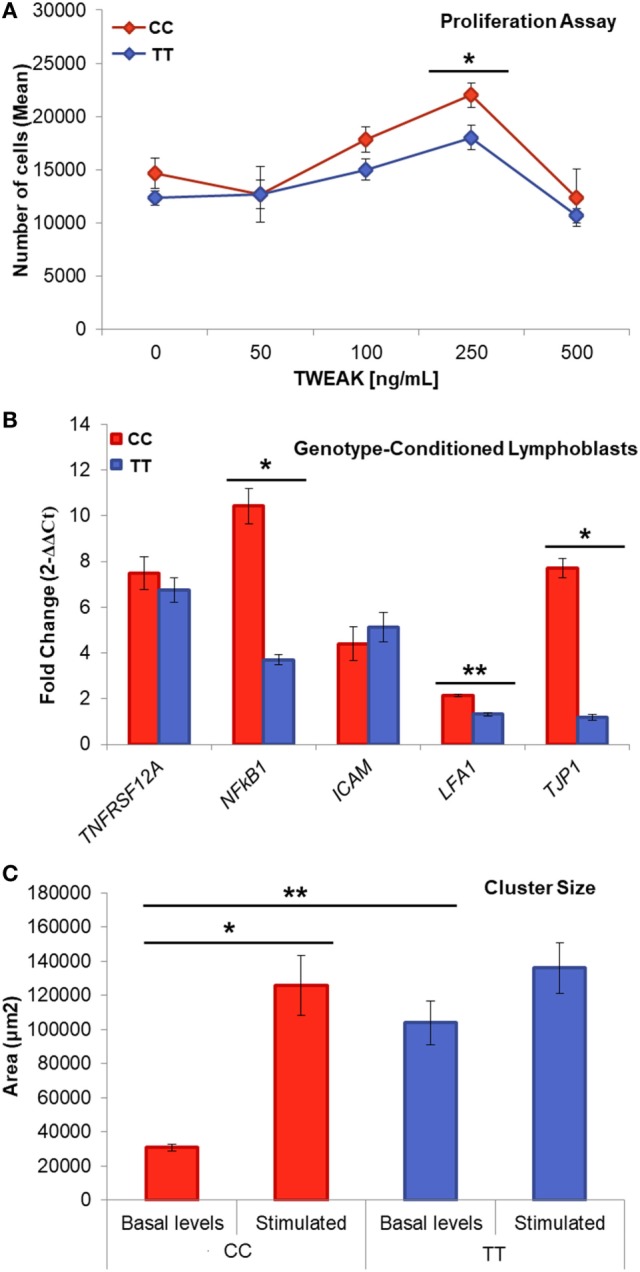
Genotype-conditioned lymphoblastoid cell lines (LCL) for rs4947296. (A) Proliferation assay of homozygous LCL treated with tumor necrosis factor-like weak inducer of apoptosis (TWEAK; 0, 50, 100, 250, and 500 ng/mL) and measured using PrestoBlue™ (*p < 0.05). Comparisons between groups were achieved using a two-sided Student’s t-test. (B) Relative gene expression according to the genotype, after treatment with 250 ng/mL of TWEAK, p-values: TNFRSF12A = 0.44; NFKB1 = 1.36 × 10⁻⁴; ICAM = 0.91; LFA-1 = 5 × 10⁻⁶; TJP1 = 3.2 × 10⁻⁵ (*p < 1 × 10⁻⁴, **p < 5 × 10⁻⁶) (C) Cluster size within LCLs with and without stimulation (**p = 5 × 10⁻⁷, *p = 0.02). CC, risk genotype; TT, protective genotype.
