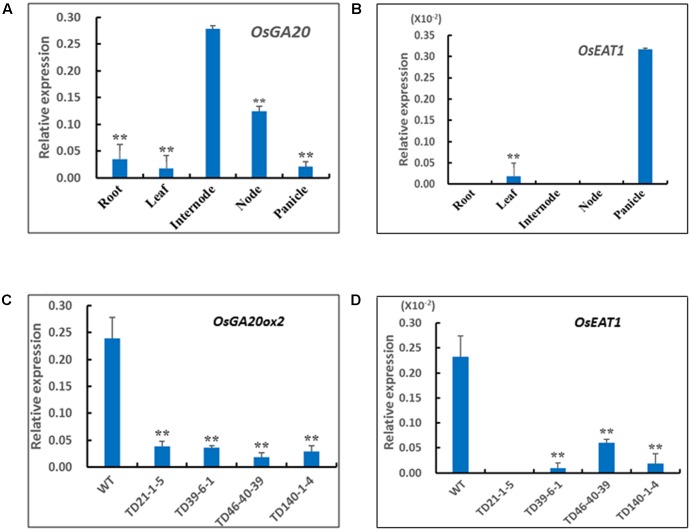
FIGURE 5.
Expression patterns of OsGA20ox2 and OsEAT1 in DMS rice and the WT Z0201. (A) Tissue-specific expression pattern of OsGA20ox2 in Z0201. (B) Tissue-specific expression pattern of OsEAT1 in Z0201. (C) Relative expression levels of OsGA20ox2 in stem internodes of transgenic DMS rice lines and WT at heading stage. (D) Relative expression levels of OsEAT1 in panicles of transgenic DMS rice lines and WT at heading stage. The rice Ubi gene was used as an internal control. The data are shown as mean values ± SD from three replicates. The asterisks indicate significant difference (one-tail t-test, compared with WT, ∗∗P < 0.01; ∗P < 0.05).

