Figure 4.
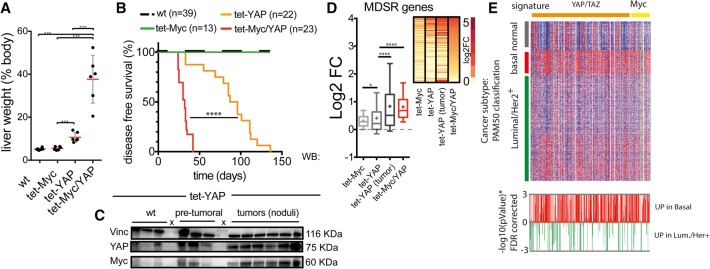
Myc and YAP cooperate in inducing liver growth and tumorigenesis. (A) Liver weight assessed at 5 wk of induction. Data are reported as percentage relative to total body weight. (B) Kaplan-Meier disease-free survival analysis. (C) Western blotting analysis of YAP and Myc levels in LAP-tTA tet-YAP mice at the pretumoral stage (4 wk of YAP activation) and in tumors. Vinculin (vin) was used as aninternal control for equal loading. (D) Box plot of the expression level of MDSR genes up-regulated in the liver upon YAP and/or Myc induction. (Inset at the right) Ranked heat map. (E, top panel) Heat map of Myc and YAP/TAZ gene signatures based on the expression data of breast cancers (TCGA_BRCA). The heat map was clustered by breast cancer subtypes (basal-like, normal-like, and Luminal/Her2+). (Bottom panel) The statistical track shows the logarithmic plot of P-values for each gene. (Red bars) Genes up in basal-like; (green bars) genes up in Luminal/Her+.

