Figure 5.
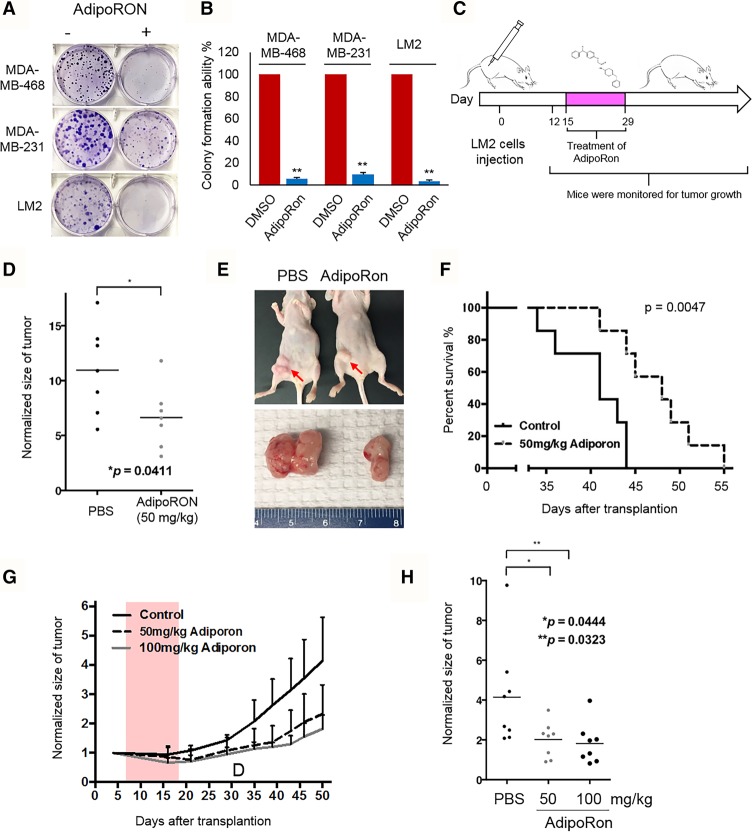
Targeting AdipoR1 signaling in SET1B-expressing triple-negative breast cancer. (A) MDA-MB-231, MDA-MB-468, and LM2 cells were seeded in six-well plates at a concentration of 200 cells per well. The cells were treated with either DMSO or 10 µM AdipoRON for 3 wk, and the colonies were stained with crystal violet. (B) Quantification of crystal violet staining was determined as described in the Materials and Methods. n = 4. (**) P < 0.01, Student's t-test was used for statistical analysis. Error bars represent SD. (C) Flow chart of the animal experiments in D–F. (D) LM2 cells (4 × 10⁶ cells) were inoculated into the fat pads of nude mice. Twelve days after injection, when the tumors reached 100 mm3, mice were divided randomly into two groups. They were treated 10 times with either 50 mg/kg PBS or 50 mg/kg AdipoRon, and the tumor size (D,E) and animal survival (F) were monitored. Tumor growth was measured 2 wk after inoculation. n = 7. (*) P < 0.05, Student's t-test was used for statistical analysis. Log-rank test was used to determine differences between the survival of each group. (G) LM2 cells (4 × 10⁶ cells) were inoculated into the fat pads of nude mice. Twelve days after injection, when the tumors reached 100 mm3, mice were divided randomly into three groups. They were treated 10 times with either 50 mg/kg PBS or 100 mg/kg AdipoRon, and the tumor size was monitored. (H) Tumor growth was measured 2 wk after inoculation. n = 8. (**) P < 0.01; (*) P < 0.05, Student's t-test was used for statistical analysis.

