Figure 2.
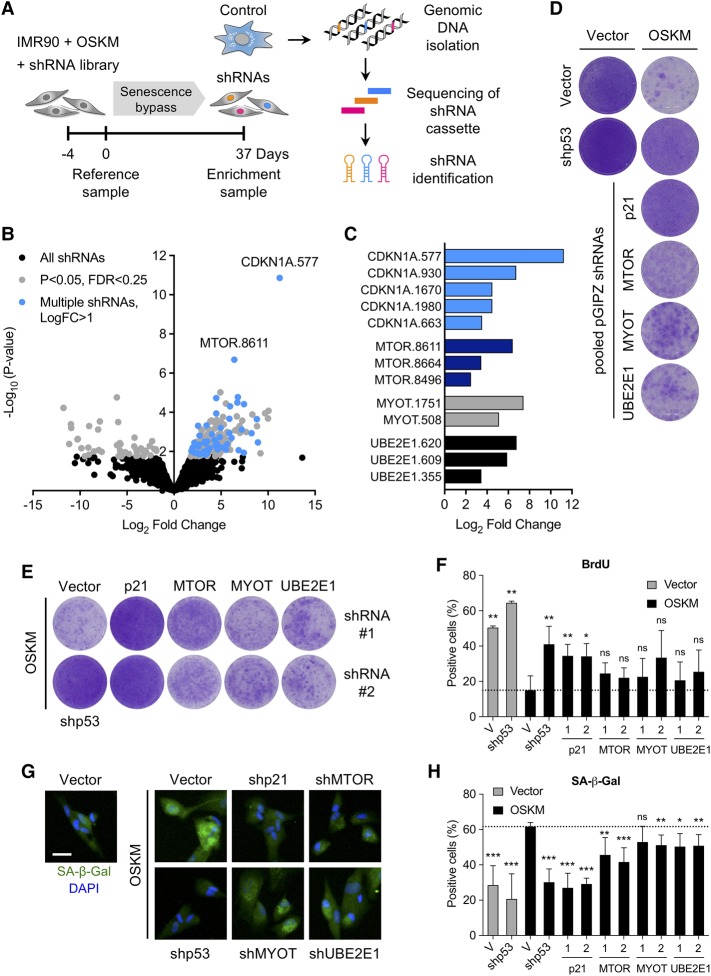
An shRNA screen identifies modulators of reprogramming-induced senescence. (A) Time line and strategy of a secondary shRNA enrichment screen. IMR90 fibroblasts were infected with an OSKM expression vector followed by a pooled shRNA library in duplicate. Samples for analysis of shRNA library representation were taken at regular intervals over a 37-d culture period. Two independent biological shRNA screens were performed. (B) Volcano plot depicting the changes in representation (log2 fold change; X-axis) and significance (−log10-converted P-value; Y-axis) of each shRNA in the library at day 37 versus day 0. Total library (black; 3153 shRNAs), enriched shRNAs (gray; P < 0.05; FDR < 0.25; 229 shRNAs), and candidates with multiple shRNAs (blue; log2 fold change > 1; 52 shRNAs) are shown. The top shRNAs targeting CDKN1A and MTOR are highlighted. EdgeR statistical analysis was used to combine and batch-correct data from two independent biological screens. (C) Significantly enriched (log2 fold change) shRNAs for CDKN1A, MTOR, MYOT, and UBE2E1. (D) Initial validation of candidates identified in the secondary screen. IMR90 fibroblasts were infected with control or OSKM expression vector and pooled pGIPZ shRNAs against the indicated candidates. Cell proliferation was assayed by crystal violet staining. (E) IMR90 fibroblasts were infected with OSKM followed by two different shRNAs against p21, MTOR, MYOT, and UBE2E1. At 12 d after infection, cells were seeded at low density. After 16 d, plates were stained with crystal violet. Images are from a representative experiment. (F) IMR90 fibroblasts were infected with empty vector (gray bars) or OSKM (black bars) followed by shp53 or two different shRNAs against p21, MTOR, MYOT, and UBE2E1 or control vector (V). At 12 d after infection, cells were seeded in 96-well plates and cultured for another 5 d. The percentage of BrdU-positive cells was determined by immunofluorescence after an 18-h pulse with BrdU. Error bars represent the SD of three independent experiments. (*) P < 0.05; (**) P < 0.01; (ns) not significant. (G) IMR90 fibroblasts were treated as described in F. At 12 d after infection, cells were seeded in 96-well plates. The next day, SA-β-Gal activity was determined by fluorescence staining. Representative images are shown for cells infected with the indicated vectors. Bar, 30 µm. (H) Quantification of SA-β-Gal-positive cells treated as described in G. (Gray bars) Cells infected with empty vector control (V); (black bars) cells infected with OSKM vector. Error bars represent the SD of at least three independent experiments. (*) P < 0.05; (**) P < 0.01; (***) P < 0.001; (ns) not significant.

