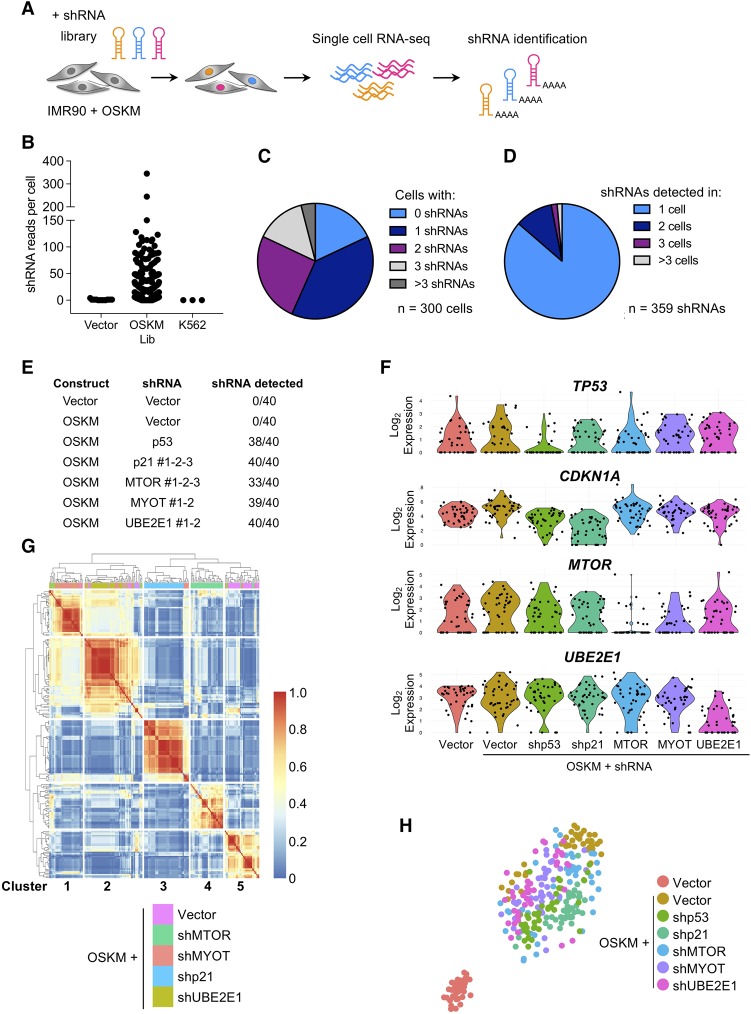
Figure 3.
Coupling scRNA-seq with shRNA assignment identifies expression profiles associated with gene knockdown. (A) Strategy of scRNA-seq analysis of IMR90 cells infected with OSKM and an shRNA library. RNA-seq libraries were prepared using the ICELL8 single-cell system. (B) The number of shRNA-specific reads plotted for IMR90 cells infected with empty shRNA vector (no shRNA-specific insert; n = 50), OSKM and shRNA library cells (OSKM/Lib; n = 300), and K562 control cells that were not exposed to shRNA vectors (n = 50). (C) Pie chart showing the number of different shRNAs that could be detected per cell. One or more shRNAs could be detected in 82% of the single-cell libraries (246 out of 300), while 18% (54 out of 300) had no detectable shRNA reads. (D) Pie chart showing the occurrence of the 359 different shRNAs that were detected in 300 OSKM/Lib RNA-seq libraries. Overall, 86% (310 out of 359) of the shRNAs were found uniquely in one cell, while 14% (49 out of 359) of the hairpins were detected in two or more cells. (E) Experimental setup of the scRNA-seq experiment. Vector or OSKM-expressing IMR90 cells were infected with the indicated shRNAs. For each condition, 40 single cells were used for scRNA-seq analysis. RNA-seq libraries were prepared using the ICELL8 single-cell system (WaferGen Biosystems). (F) Violin plots of TP53, CDKN1A, MTOR, and UBE2E1 mRNA expression of single cells infected with the indicated constructs. (G) Heat map and clustering analysis of differentially expressed genes of OSKM-expressing cells infected with vector, shp21, shMTOR, shMYOT, and shUBE2E1 resulted in five clusters, each enriched for cells containing shRNAs targeting a different gene. (H) The t-distributed stochastic neighbor embedding (t-SNE) plot of the 280 single cells depicts the separation into shp53, shMTOR, shCDKN1A, shMYOT, and shUBE2E1 relative to vector and OSKM control cells.

